If you cannot see the graphic or access the links within this message please go to the source
|
 |
 |
|
Structural factors reassert themselves as caution dominates
In the second half of 2022, the defining characteristic of any commercial asset was its sensitivity to interest rates. In that environment, assets which had been considered to have attractive growth prospects were now most obviously overpriced relative to the cost of debt and the risk-free rate. This led to a stark reversal of the natural order, with industrial asset values declining by 27% despite recording income growth of 8%, whilst shopping centre values only fell by 10% despite a sixth consecutive year of declining income. This relativity does not however reflect a significant change in the perceived growth prospects of the two sectors. Rather it highlights the transparent nature and immediate transmission of interest rate effects. Low yielding assets were inherently more exposed to the dramatic change in the cost of money and the implications of that change were clear to see, giving valuers the license to move with unprecedented speed.
In the absence of another (currently unexpected) spike in interest rates, normal service is set to resume this year, with valuation movements once again driven by asset fundamentals rather than monetary considerations. In what is currently a very thin investment market, investors are fully focused on assets that benefit from structural demand growth, scarcity value or income security, and preferably all three. At the time of writing, barely £6bn of assets have traded across the whole market this year, compared to over £19bn in the first quarter of 2022. More than half of this total was accounted for by just 10 trades, the nature of which illustrates where demand is currently active. Two prime central London offices with top BREEAM ratings and long income, two BTR portfolios, a portfolio of supermarket reversions (twice), an office development pre-let to the government, a portfolio of long-let car parks, and the St Katherine’s Dock estate. In stark contrast, the entire shopping centre and regional office sectors together have attracted barely £100m of reported transactions so far this year. |
|
Commercial property returns
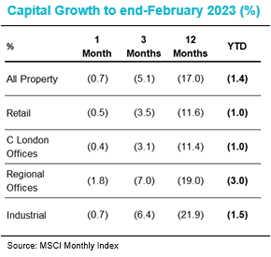
- The MSCI Monthly Index fell by a further 0.7% in February, taking the cumulative decline since mid-2022 to just over 21%. The rate of decline has slowed markedly in the early months of 2023, having fallen at a record speed through the second half of 2022.
- Offices have taken over as the fastest declining sector in recent months, with values off by 2.2% so far this year, but there is an increasingly wide spectrum of returns in the sector. Office parks in London and the South-East are down by 6% this year and by 22.3% from peak. In contrast, West End values are down by just 0.4% this year and 11.1% from peak.
- Industrial values are down by 1.5% this year and by 27.8% from their peak. The lowest yielding regions have been hit the hardest (London -32.4% from peak) whilst the higher yielding regions have been slightly more resilient (Scotland & the North -23.3% from peak). Rental values are up by 9.9% year-on-year, slightly down on an August ’22 peak rate of 13.2%.
- At a sector level, Retail values have looked more resilient, with higher yielding assets being less exposed to interest rate movements. This was notably the case for shopping centres. However, whilst centres in Southern England have seen values supported by alternative use value, those outside the South saw their values drop by 5.7% at the start of 2023.
|
|
Investment market activity
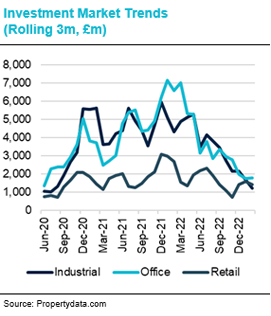
- £1.6bn of transactions completed in February, slightly higher than the total from January, yet still one of the weakest months in the last decade. The number of deals to complete was just 82, the lowest of any month since 2009, at the height of the Global Financial Crisis.
- The largest trade, a 50% share of One Fen Court, accounted for a fifth of the entire total. The reported sale price of £320m would reflect a yield of 4.25% for the BREEAM Excellent rated office, which was completed in 2018. The purchaser, Munich Re, also occupies two floors of the tower.
- The next largest deal to complete in February was hardly reflective of the mainstream commercial property market. A JV led by Greenpoint Partners acquired 37 carparks for £305m. 33 of the assets are leased to NCP car parks with the rest on management contracts. Vendors Davidson Kempner first put the portfolio up for sale in early 2020.
- Build-to-Rent sparked back to life in February, with three significant deals completing for a combined £538m. A JV between Ridgeback Group and Angelo Gordon forward funded two schemes in North London for £225m. Sigma Capital committed £205m to 11 schemes with Countryside Partnerships. Realstar committed £108m for 488 units in Leeds.
- An unusually large number of hotels traded in the month; with £230m invested across 14 deals. The most notable were the Grand Hotel in Brighton, acquired by Fattal Properties for £60m, and the Queens Hotel in Leeds, acquired by Pandox for £53m. In London, Dalata Hotel Group acquired the 191-bed Maldron hotel for £44.3m and Jastar Capital acquired the Native Bankside aparthotel for £40m.
|
|
Market yields
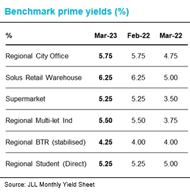
- There were further signs of stabilisation in market pricing in February. JLL report that all commercial benchmark yields which were previously considered to be trending “weaker” have now moved to “stable”. However, this should be caveated by the fact that there has been very little transactional evidence for this to date.
- JLL believe that the next movement for benchmark industrial yields is likely to be inwards, moving all six segments to “trending stronger” from a previous rating of “stable”. Benchmark yields in the industrial sector have moved out by up to 200bp since June ’22, from a 3.0-3.75% range to 5.0-5.5%.
- JLL report the first sign of actual yield compression since the market turned last summer, with the benchmark for prime retail parks hardening from 6% to 5.75%. Nonetheless, this new level is still 125bp out from last June. JLL perceive that secondary shopping centre yields have stabilised at 14%, but in practice values are driven primarily by alternative use value.
- Values in the “living” sectors have been stickier than their commercial counterparts, yet they are not immune from interest rate effects. JLL estimate that prime and secondary benchmarks for regional Build-to-Rent have softened by 25bp over the last month, to 4.25% and 4.75% respectively. JLL believe that yields are likely trending weaker across all their BTR and PBSA (student accommodation) benchmarks.
|
|
Auctions
- 72 lots were sold at the Allsop commercial auction in March, raising £52.6m. The success rate of 75% was an improvement on the February auction but still some way of the long-run average of around 85%. Nonetheless, year-to-date sales and process are up by 25% and 8% respectively against 2022.
- Neighbourhood retail parades, especially those with a residential angle, have long been a favourite of private investors. One such asset in Orpington, comprising 35 shops and four maisonettes, achieved a price exceeding £4m, reflecting a yield of 7.4%. The London Borough of Bromley successfully sold six similar lots for a total of £9.5m.
|
|
Market forecasts
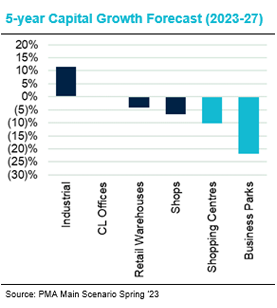
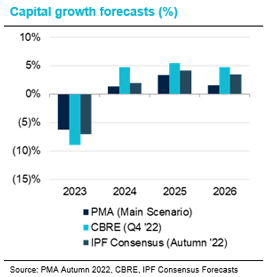
- The latest base case forecasts from PMA predict a further 6.6% fall in average capital values across the mainstream commercial property sectors this year. Adjusting for the 1.4% decline already recorded in January and February, this implies a further decline in valuations of circa 5%.
- This average marks a very wide variation across sectors, with the relativity being very different to that recorded last year. The Industrial sector recorded the largest falls in 2022, but PMA expect it to outperform this year with a full year forecast of -2.1% implying that we are already at the bottom of the cycle.
- The picture is very different for offices, where PMA expect values to fall by 10.6% this year. London West End is expected to be relatively resilient (-6.8%), whilst regional office values are expected to fall by a further 15% this year and to continue to drift down through 2024. The picture is also relatively weak for Retail, with values expected to fall by a further 9% this year.
- In contrast, the beds sectors look relatively resilient, with student halls values expected to be broadly flat this year. Residential investment values are expected to fall, by 9% in Central London and 5% in the regions, yet rents are expected to continue to rise throughout the forecast period.
|
|
Looking forward
The benchmark yield schedules published by the major agencies offer a rather comforting picture, suggesting that after the rapid repricing seen in the second half of 2022 some sort of equilibrium has been reached. The problem is that market pricing should broadly reflect the point at which there is an equal number of buyers and sellers. It is very hard to say with any confidence that is the case when there are so few transactions being completed across whole swathes of the market. Of course, investment agents have far greater visibility of the deal pipeline than most of us and can therefore factor in transactions not yet in the public domain, as well as making an assessment of deals that never quite made it cross the line. It is possible therefore that the quoted benchmark yields are a fair reflection of pricing at which deals could be done if the would-be vendors were more motivated to sell.
This gap between vendor aspiration and buyer appetite will clearly need to close before transactional activity can recover. In all previous cycles it has been those assets with a depth of tenant demand and the potential for income growth which trade first, and this cycle will be no different. Liquidity will therefore return fastest for modern logistics, good quality BTR, highly sustainable city centre offices, and student halls close to the strongest institutions. For many other assets we’re likely to see a much more protracted journey with a prolonged period of weak liquidity. In such a market, forced sellers are likely to emerge and a second lurch down in values is probable. The highest risk parts of the market are those assets where future tenant demand is highly uncertain, and the cap ex required for repurposing would be significant. Shopping centres have long inhabited this dark corner of the market, and out of town office parks may find themselves in a similar position. Whilst some offer valuable clustering benefits and a minority have exceptional amenities, many are little more than a low cost home for back office functions, leaving them very exposed to the impact of evolving working practices. |
|
For further information please contact:
Author – Tom Sharman, Head of Strategy, Real Estate Finance, NatWest Group
For further info contact:
Ross Ironside
Coutts & Co - Head of Commercial Real Estate
E-mail: Ross.ironside@Coutts.com |
|
This document has been prepared by National Westminster Bank Plc or an affiliated entity (“NatWest”) exclusively for internal consideration by the recipient (the “Recipient” or “you”) for information purposes only. This document is incomplete without reference to, and should be viewed solely in conjunction with, any oral briefing provided by NatWest. NatWest and its affiliates, connected companies, employees or clients may have an interest in financial instruments of the type described in this document and/or in related financial instruments. Such interests may include dealing in, trading, holding or acting as market-maker in such instruments and may include providing banking, credit and other financial services to any company or issuer of securities or financial instruments referred to herein. NatWest is not and shall not be obliged to update or correct any information contained in this document. This document is provided for discussion purposes only and its content should not be treated as advice of any kind. This document does not constitute an offer or invitation to enter into any engagement or transaction or an offer or invitation for the sale, purchase, exchange or transfer of any securities or a recommendation to enter into any transaction, and is not intended to form the basis of any investment decision. This material does not take into account the particular investment objectives, financial conditions, or needs of individual clients. NatWest will not act and has not acted as your legal, tax, regulatory, accounting or investment adviser; nor does NatWest owe any fiduciary duties to you in connection with this, and/or any related transaction and no reliance may be placed on NatWest for investment advice or recommendations of any sort. Neither this document nor our analyses are, nor purport to be, appraisals or valuations of the assets, securities or business(es) of the Recipient or any transaction counterparty. NatWest makes no representation, warranty, undertaking or assurance of any kind (express or implied) with respect to the adequacy, accuracy, completeness or reasonableness of this document, and disclaims all liability for any use you, your affiliates, connected companies, employees, or your advisers make of it. Any views expressed in this document (including statements or forecasts) constitute the judgment of NatWest as of the date given and are subject to change without notice. NatWest does not undertake to update this document or determine the accuracy or reasonableness of information or assumptions contained herein. NatWest accepts no liability whatsoever for any direct, indirect or consequential losses (in contract, tort or otherwise) arising from the use of this material or reliance on the information contained herein. However, this shall not restrict, exclude or limit any duty or liability to any person under any applicable laws or regulations of any jurisdiction which may not be lawfully disclaimed. The information in this document is confidential and proprietary to NatWest and is intended for use only by you and should not be reproduced, distributed or disclosed (in whole or in part) to any other person without our prior written consent.
National Westminster Bank Plc. Registered in England & Wales No. 929027. Registered Office: 250 Bishopsgate, London EC2M 4AA. National Westminster Bank Plc is authorised by the Prudential Regulation Authority, and regulated by the Financial Conduct Authority and the Prudential Regulation Authority. |
|
|