If you cannot see the graphic or access the links within this message please go to the source
|
 |
Not as good as gold but just maybe as safe as houses
The history books may one day show that the early months of 2025 marked the onset of truly seismic changes to the global economic order. Yet whilst geopolitical developments have been anything but benign, UK property market returns data for the first quarter look exactly that. MSCI data show that in Q1, average commercial property asset values increased at an annualised rate of 2.5%, comfortably underwritten by annualised rental growth of circa 3.6%, slightly ahead of inflation in the wider economy.
The contrast with volatile equity and bond markets can rarely have been so stark. Of course, the picture is more nuanced than the headline data would suggest; property valuations lag real world developments, and the worst of the equity market volatility has occurred since the end of March. However, it raises the question of whether the real estate market can really buck the trend of volatility in both equity and bond markets.
The reality is that even the first order effects of the nascent trade war are hard to predict, and the real estate market is more likely to be impacted by second or third order effects.
|
Nonetheless, real estate has always occupied a space somewhere between equities and bonds, which may provide some protection in the current environment. A real estate investment should (in theory) deliver a combination of bond-like income streams, with the added potential of equity-like upside through rental growth. This upside is particularly useful in a world where investors are nervous about inflation.
Whilst very few real estate assets offer genuine inflation mitigation, many can be expected to deliver nominal income growth over time, giving them an advantage over bonds. Relative to equities, the largest proportion of real estate total returns come from contractual income streams, providing some insulation to fluctuating business confidence.
Of course, the real estate sector is not immune, as illustrated by the reduced pace of recovery since the start of the year. However, having already seen a significant value correction in 2022/23, it is arguable that real estate had more downside priced in at the start of this year than the two larger asset classes. |
|
Commercial property returns
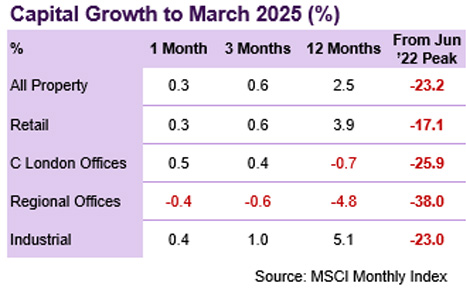
According to MSCI, average commercial property values increased by 0.3% in March, taking the cumulative recovery to 2.5% since this time last year. However, the trend rate of growth has halved, from 1.5% in Q4 last year to just 0.6% in the first quarter of ’25. Values are on average still 23.2% below their June ’22 peak.
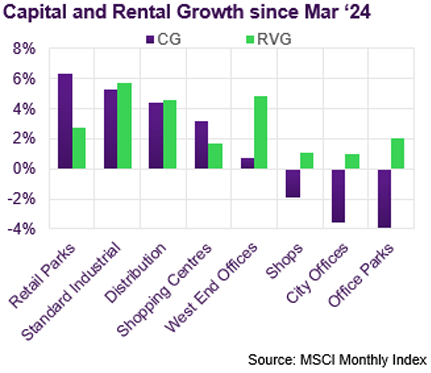
Standard Industrial has been the leading sub-sector in the first quarter of 2025, with quarterly value growth of 1.0%, although this is less than half the rate recorded in the previous quarter (2.3%). Value growth has slowed even further for distribution warehouses, from 2.3% to 0.7%. Both sub-sectors continue to benefit from solid rental growth of circa 4% per annum.
Retail Parks were the strongest performing sub-sector over the last 12 months, with capital growth of 7.0%, but the quarterly growth rate has dropped from 2.5% in Q4 to 0.7% in Q1. Supermarkets bucked that slower trend, with capital growth increasing in Q1 relative to the previous quarter (1.0% vs 0.5%), turning annual growth positive for the first time since 2022.
The office market appears to be characterised by a divergence between Central London (values up 0.4% Q-on-Q), and the rest of the country (down 0.6% on average). Yet that simple picture masks more nuance, where the Outer South East (possibly driven by life sciences) is the strongest performer, whilst London City values remain soft. |
Investment market activity
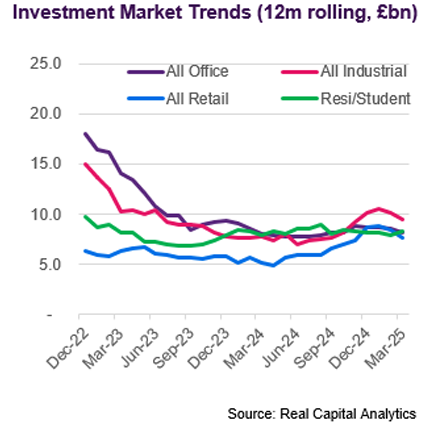
Preliminary data from Real Capital Analytics indicate that £2.4bn of transactions completed in March. Whilst this is a marked improvement on an exceptionally weak February (£1.3bn), it nonetheless continues to reflect a very slow market. The Q1 total of £6.7bn is around a third below the same periods in 2023 and 2024 and 70% down on Q1 2022.
The Living sectors bucked the trend to some extent, boosted by some notable multi-family transactions. In Leeds, Barings committed £152m to Glenbrook’s 618-unit Kirkstall Road scheme, the largest forward funding in the city to date. In Manchester, KKR acquired L&G’s Slate Yard scheme, comprising 424 units across 3 buildings, for £100m.
The largest transaction in mainstream commercial sectors was the sale by Lendlease of a 20% share in 21 Moorfields for c£148m. The partial interest in Deutsche Bank’s London HQ was acquired by Japanese investors at a price reflecting a total value of £740m at an initial yield of c5%.
A handful of other London office deals closed, including the sale by Angelo Gordon and Endurance Land of 25 Finsbury Circus for £72.5m. The asset, acquired by Malaysian developer IJM Corporation, is currently being redeveloped, with a pre-let agreed with law firm Simmons & Simmons
Barings and Rosethorn Capital agreed the largest student deal of the year so far, paying £101.4m for CLS Holdings’ Spring Mews scheme. The 378-bed scheme in Vauxhall was built in 2014 and includes a gym, swimming pool and cinema room. |
Market yields
There has been dramatic bond yield volatility over the last month as the market has absorbed various announcements, clarifications, and revisions to US government policy on trade. However, the net result has been that the benchmark ten-year Gilt yield is slightly lower at the time of writing (4.55%) than it was a month earlier (4.72%).
Markets are now anticipating three further cuts to UK base rate this year, and as a result medium-term rates have also come in quite materially over the last month. The five-year SONIA swap was trading at 3.6% at the time of writing, down from 4.0% a month earlier.
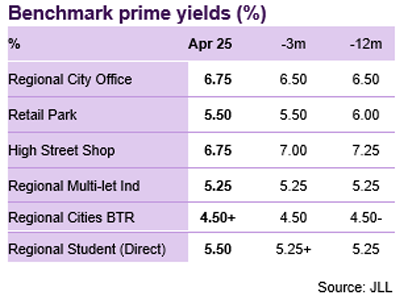
JLL’s latest monthly report of market yields suggests that all mainstream commercial benchmarks have remained flat over the last month. The only change they’ve perceived is that the outlook for the largest City of London office assets (>£125m) has improved, and that prime yields for such assets are expected to come in from their current level of 5.75%.
There has also been very little change amongst living sectors, with the exception of elderly care, where JLL perceive that prime and “ultra-prime” yield benchmarks have softened by 25bp to 5.25% and 4.75% respectively. BTR benchmarks are perceived to be stable, within a very narrow range from 4.25% for prime London to 5.0% for secondary regional. PBSA benchmarks have a wider spread, from 4.5% to 7.25%. |
Auctions
Data from EIG illustrate a relatively slow start to the year for the auction market. Lots listed across the country in Q1 were down by 2.1% year-on-year, sales were down 3.4% and proceeds down by 4.3%. The sales rate was down at just under 70%, compared to perhaps 75-80% in a strong market.
Hesitancy amongst investors, and the difficulty of pricing assets, was illustrated in Allsop’s March auction. 106 lots were listed, yet barely half had sold by the end of the auction. At that point, proceeds of £33m compared to £75m raised from the March ’24 auction. However, since the auction, 13 more lots have sold, raising a further £10m. |
Market forecasts
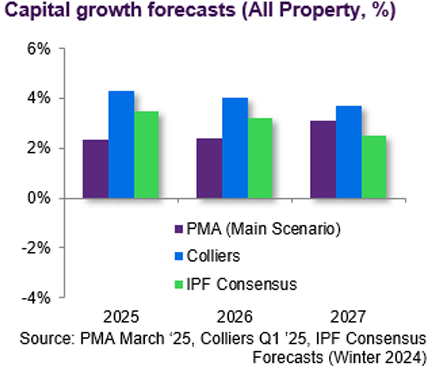
Independent forecaster PMA released their latest forecasts in March. Their main scenario is based on consensus economic forecasts of sluggish GDP growth (1.2% this year and 1.8% in 2026 & ‘27), moderately above target inflation and a gradual fall in base rate to 3.75% by 2026.
PMA anticipate that, on average, commercial property values will rise by 8% over a 3-year horizon (2025-27). However, they predict that Industrial will outperform, with capital growth of 14% over the same period. They expect this appreciation to be well underwritten by almost 11% of rental value growth.
Whilst Retail has been relatively resilient over the recent cyclical downturn, PMA predict that the sector will resume its previous position as sectoral underperformer, with cumulative capital growth of just 2.1% over 3 years. This relatively downbeat outlook comes despite their forecast of reasonably healthy rental value growth of 5.4% over the same period.
PMA’s forecast for the office sector is decidedly mixed, with capital growth of almost 11% expected in Central London, supported by rental growth of 12-15%. In contrast, a capital value decline of c11% is anticipated in West M25 markets, with no rental growth at all. Robust rental growth is forecast for the major regional Cities, but capital values are expected to drift sideways. |
Looking forward
The key driver of property values since 2022 has been the level of interest rates and expectations for their future path. One side-effect of current events is that markets are now expecting further cuts to base rate, manifesting in materially lower medium-term swaps. At the time of writing, a five-year SONIA swap was trading at around 3.6%, so hedging can once again help to reduce interest cover constraints for investors seeking moderate leverage. The domestic risk-free rate has also settled down after a bout of volatility, bringing hurdle returns back to achievable levels.
In parts of the property market, notably residential and industrial, the yield spread between prime and secondary assets has become compressed as interest rates rose. It seems likely that as rates pressure is reduced, higher quality assets will benefit quite quickly, but that this will not necessarily spread into higher yielding assets. In the office and retail sectors this spread has been significantly wider and may now become wider still. With signs of competitive tension returning for the strongest office and retail assets, occupiers with expansion plans may have little option but to press ahead there, whereas the temptation to delay will be far stronger where that pressure is absent. |
Visit us
Discover a wealth of
real estate expertise, regardless of your business level or stage.
 |
| It would be a serious stretch to claim that even prime real estate is a safe haven. That status has clearly been bestowed upon gold, which saw a 30% rise as investors fled other assets classes. However, as a real asset, property shares a key characteristic with the yellow metal, and comes with the added inducement of an income return whilst you wait. Property investment may not be “as good as gold”, but the adage “as safe as houses” illustrates the enduring value of well-located real estate with broad-based demand. |
|
|
If you would like to opt out, please get in touch with your Relationship Manager.
The Royal Bank of Scotland plc, The Royal Bank of Scotland N.V, or an affiliated entity (‘RBS’) and for the purposes of Directive 2004/39/EC has not been prepared in accordance with the legal and regulatory requirements to promote the independence of research. Regulatory restrictions on RBS dealing in any financial instruments mentioned at any time before this document is distributed to you do not apply. This document has been prepared for information purposes only. It shall not be construed as, and does not form part of an offer, nor invitation to offer, nor a solicitation or recommendation to enter into any transaction or an offer to sell or a solicitation to buy any security or other financial instrument. No representation, warranty or assurance of any kind, express or implied, is made as to the accuracy or completeness of the information contained herein and RBS and each of their respective affiliates disclaim all liability for any use you or any other party may make of the contents of this document. The contents of this document are subject to change without notice and RBS does not accept any obligation to any recipient to update or correct any such information. Views expressed herein are not intended to be and should not be viewed as advice or as a recommendation. RBS makes no representation and gives no advice in respect of any tax, legal or accounting matters in any applicable jurisdiction. This document is not intended for distribution to, or use by any person or entity in any jurisdiction or country where such distribution or use would be contrary to local law or regulation. The information contained herein is proprietary to RBS and is being provided to selected recipients and may not be given (in whole or in part) or otherwise distributed to any other third party without the prior written consent of RBS. RBS and its respective affiliates, connected companies, employees or clients may have an interest in financial instruments of the type described in this document and/or in related financial instruments. Such interest may include dealing in, trading, holding or acting as market-makers in such instruments and may include providing banking, credit and other financial services to any company or issuer of securities or financial instruments referred to herein. The Royal Bank of Scotland plc. Registered in Scotland No. 90312. Registered Office: 36 St Andrew Square, Edinburgh EH2 2YB. The Royal Bank of Scotland plc is authorised by the Prudential Regulation Authority and regulated by the Financial Conduct Authority and Prudential Regulation Authority. The Royal Bank of Scotland N.V., established in Amsterdam, The Netherlands. Registered with the Chamber of Commerce in The Netherlands, No. 33002587. Authorised by De Nederlandsche Bank N.V. and regulated by the Authority for the Financial Markets in The Netherlands. Agency agreements exist between different members of The Royal Bank of Scotland Group plc.
© Copyright 2024 The Royal Bank of Scotland plc. All rights, save as expressly granted, are reserved. This communication is for the use of intended recipients only and the contents may not be reproduced, redistributed, or copied in whole or in part for any purpose without The Royal Bank of Scotland plc’s prior express consent.
|
|
|