If you cannot see the graphic or access the links within this message please go to the source
|
 |
Overseas investors finding value in UK assets and expertise
Persistently weak investment activity suggests that few investors currently see compelling value in the UK real estate market. Total transaction volumes in Q1 were a third down on last year, and two thirds below the first quarter of 2022. However, behind these headline numbers, an underlying trend indicates that one key investor group may be rediscovering their appetite.
Overseas investors, who have always been a fundamental part of the UK market, have increased activity significantly over the last year, following from a prolonged period of restraint. In the 12 months to March, investors from North America, Europe and Asia committed £22bn to acquisitions in the UK, marking a dramatic increase of more than 30% relative to the preceding 12 months.
This activity stepped up further in April, with Norwegian sovereign wealth investing £570m into Covent Garden, US bank State Street committing £333m to a London office development and New York investment manager Blue Owl allocating £200m to a supermarket portfolio.
|
An interesting feature of all three of these deals was that the overseas capital is entrusting management and/or development of the assets to UK-based expertise. Therefore, these commitments are not a mirror of the equity market where domestic champions are sometimes seen as being “lost” to overseas capital. Rather they reflect the confidence that international investors retain in the UK real estate ecosystem.
It is no accident that on a relative basis the UK attracts more overseas capital than any other market. The question is whether this nascent resurgence in inbound capital will prove to be a catalyst for a broader-based resurgence in investment market activity.
The sub-sets of the market which have seen the most encouraging signs so far are those with a strong international profile, notably Central London offices, prime London retail, and apartments in locations like Inner London and Manchester. It is to be hoped that the receipts from these transactions are recycled back into other sectors and regions, triggering a long-awaited recovery in liquidity across the UK property market as a whole. |
|
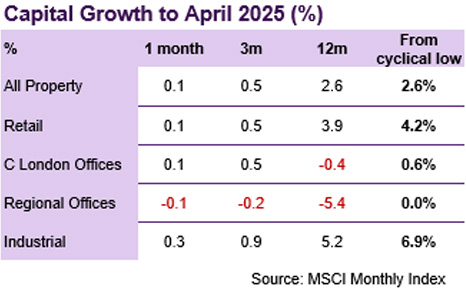
Commercial property returns
According to MSCI, average commercial property values edged upwards by 0.1% in April, taking the cumulative recovery to 2.6% since this time last year. However, the trend rate of growth has dropped, from 1.5% in Q4 last year to just 0.5% over the last 3 months. Values are on average still 23.1% below their June ’22 peak.
Standard Industrial has been the leading sub-sector so far this year, with capital values up by 1.3% YTD. The annual rate of growth also continues to rise, reaching 5.3% in April. The growth rate for distribution is also climbing, reaching 4.8%. Both sub-sector trends are well supported by rental growth (+5.7% and 4.4% YOY respectively).
Retail Parks were the strongest performing sub-sector over the last 12 months, with capital growth of 6.1%, but the quarterly growth rate has dropped from 2.5% in Q4 to just 0.5% in the last 3 months. Average shopping centre values have edged up over the last year, by 3.1%, but are still 60% below where they were 10 years ago.
Signs of value recovery in the office sector have been very limited to date, led by the East of England (read Cambridge, +2.1%), and London West End (+1.7%). In contrast, values elsewhere have drifted further down this year, notably for Office parks (-2.3%) and Outer London (-1.9%). |
Investment market activity
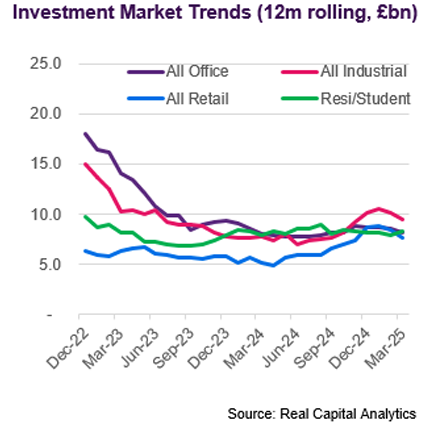
Preliminary data from Real Capital Analytics indicate that £2.7bn of transactions completed in April. This is broadly in line with March, and well up on February, but still reflects an unusually slow market. The YTD total of £11.1bn is around 20% below the same periods in 2023 and 2024 and less than half the total from the same period in 2022.
The largest deal to close in April was the purchase by Norges Bank IM of a 25% stake in Shaftesbury’s Covent Garden portfolio, for £570m. The portfolio includes Covent Garden, Seven Dials and St Martin’s Courtyard amongst 1.3m sq ft of retail, office, hotel and residential space. The acquisition price reflects a net initial yield of 3.6%.
The largest single asset transaction was the purchase by State Street of 100 New Bridge Street, which is currently being developed by Helical. The total commitment of £333m will be shared between Helical and their JV partner Orion, who bought a 50% share of the scheme last May for £55m.
The next largest transaction was the sale by Supermarket REIT of a 50% share in a portfolio, acquired by New York based investment manager Blue Owl Capital for £200m. The portfolio comprised of 5 Tesco’s, 2 Sainsburys and a Morrisons, with an average unexpired term of 11 years.
Two other significant Retail deals closed in April, illustrating a gradual recovery in appetite for large-scale assets in the sector. Farran Investments and Goldentree acquired Lakeside Retail Park for £114m from Land Securities, who continue to divest their retail warehouse holdings. Festival Place in Basingstoke, one of the largest shopping centres in the UK, was sold by receivers to Israeli investor MDSR for £99m. |
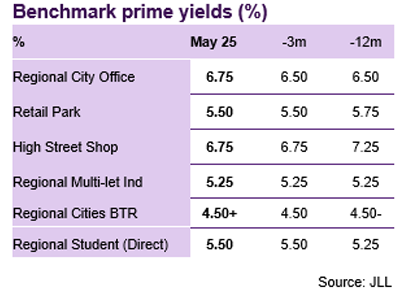
Market yields
The early months of 2025 have seen significant bond yield volatility as markets have reacted to the ever-changing landscape of US trade policy. At the time of writing, the benchmark ten-year Gilt yield was around 4.75%, about 20bp higher than it was at the end of last year.
The silver lining to this elevated economic uncertainty is that medium-term interest rates came down quite materially as markets priced in a faster pace of base rate cuts. However, this has been tempered somewhat more recently as domestic inflation and government borrowing data both exceeded expectations. At the time of writing, the five-year SONIA swap was 3.85%, only slightly lower than at the same time last year.
JLL’s latest monthly report of market yields suggests that all mainstream commercial benchmarks have remained flat over the last month. Indeed, a simple average of all the benchmarks monitored by JLL shows that the market-wide benchmark is almost exactly where it was a year ago, with some compression for prime Retail balanced by outward shift for regional offices.
Looking forward, JLL perceive little short-term movement in yields with all benchmarks for Retail, Residential, as well as most Office segments, deemed to be stable.. The few exceptions are for Industrial assets, leased hotels and larger lot City offices (>£40m) where JLL anticipate some compression. |
Auctions
Data from EIG provide some potential for optimism, showing that the total number of auction lots nationwide in April was up 26% year-on-year, and the number of successful sales was up by 48%. This pushed the success rate up dramatically, from 62% last year to 72% this. These are encouraging trends, although one months’ worth of data should clearly be treated with caution.
Allsop’s May commercial auction raised £32m, which although a relatively small take by Allsop’s standards, reflected a healthy 72% success rate. Assets with residential development potential continue to attract the keenest pricing, including a shop in North Finchley sold for £1.77m (5.3% NIY). |
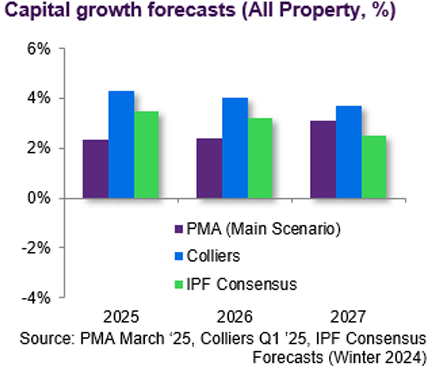
Market forecasts
The latest IPF Consensus Forecast, published in March, showed an expectation of moderate but steady growth over a five-year horizon, which would leave capital values 16% higher at the end of 2029 than they were at the start of this year. This capital appreciation was expected to be predominantly driven by rental growth, at an average of 2.6% per annum.
The Industrial sector is expected to outperform on a capital growth basis, with 3.7% per annum growth over the five-year forecast horizon. This is expected to be almost fully underwritten by rental value growth of 3.2% per annum. The consensus is broad, with the least optimistic contributor anticipating 3.0% p.a. capital growth and 2.6% p.a. rental growth.
On a total return basis, taking account of income as well as capital growth, Retail Warehouses are expected to be the top performing sub-sector over five years. The consensus forecast is for a total return of 8.6% p.a., comprising income of 6.2% and capital growth of 2.4% p.a. Shopping centres are also expected to deliver a healthy total return, of 8.0% p.a.
The consensus is less clear for offices, with capital value growth predictions ranging from just 1.3% to a more bullish 3.6% per annum. It was however, notable that for the first time this cycle all contributors expected average office values to rise throughout the five year horizon. |
Looking forward
The advantage of an open market such as the UK, with solid legal foundations and good levels of transparency, is that liquidity can be accessed from countries at different stages of their economic cycle and with diverse funding models, investment horizons and return requirements. Whilst UK investors will typically assess value in real estate by reference to Gilt yields, Sonia swap rates and other domestic instruments, overseas investors will judge relative value against other metrics which may allow them to pay a higher price than might seem justified by a domestic investor. A Japanese government bond currently yields around 1.5%, in contrast to the equivalent UK Gilt which yields around 4.75%. A Japanese institution therefore may reasonably be prepared to accept a keener yield on a UK property than a UK-based institution might. Another factor is the sheer size of some sovereign wealth funds and amalgamated pension funds, which allow them to make very large investments in illiquid assets and take a patient approach to returns.
In the short-term, the very welcome rebound in overseas investment may spark a wider increase in transaction volumes as receipts are recycled and price discovery improves. Medium-term interest rates have edged into territory that support sensible leverage and many property companies and private investors are itching to deploy their much talked about “dry powder”. However, for a broad-based and sustained recovery in investment market liquidity, domestic institutional investors are going to have to play a key part. Defined Benefit (DB) pension funds have been rotating out of illiquid assets and this gap will need to be filled by Defined Contribution (DC) funds and others. Some large domestic institutional investors have already demonstrated active appetite for patient investment in illiquid assets, but wider uptake will be fundamental to providing the full spectrum of investor demand in the UK without having to rely on overseas capital to fill the gap. |
Visit us
Discover a wealth of
real estate expertise, regardless of your business level or stage.
 |
|
|
If you would like to opt out, please get in touch with your Relationship Manager.
The Royal Bank of Scotland plc, The Royal Bank of Scotland N.V, or an affiliated entity (‘RBS’) and for the purposes of Directive 2004/39/EC has not been prepared in accordance with the legal and regulatory requirements to promote the independence of research. Regulatory restrictions on RBS dealing in any financial instruments mentioned at any time before this document is distributed to you do not apply. This document has been prepared for information purposes only. It shall not be construed as, and does not form part of an offer, nor invitation to offer, nor a solicitation or recommendation to enter into any transaction or an offer to sell or a solicitation to buy any security or other financial instrument. No representation, warranty or assurance of any kind, express or implied, is made as to the accuracy or completeness of the information contained herein and RBS and each of their respective affiliates disclaim all liability for any use you or any other party may make of the contents of this document. The contents of this document are subject to change without notice and RBS does not accept any obligation to any recipient to update or correct any such information. Views expressed herein are not intended to be and should not be viewed as advice or as a recommendation. RBS makes no representation and gives no advice in respect of any tax, legal or accounting matters in any applicable jurisdiction. This document is not intended for distribution to, or use by any person or entity in any jurisdiction or country where such distribution or use would be contrary to local law or regulation. The information contained herein is proprietary to RBS and is being provided to selected recipients and may not be given (in whole or in part) or otherwise distributed to any other third party without the prior written consent of RBS. RBS and its respective affiliates, connected companies, employees or clients may have an interest in financial instruments of the type described in this document and/or in related financial instruments. Such interest may include dealing in, trading, holding or acting as market-makers in such instruments and may include providing banking, credit and other financial services to any company or issuer of securities or financial instruments referred to herein. The Royal Bank of Scotland plc. Registered in Scotland No. 90312. Registered Office: 36 St Andrew Square, Edinburgh EH2 2YB. The Royal Bank of Scotland plc is authorised by the Prudential Regulation Authority and regulated by the Financial Conduct Authority and Prudential Regulation Authority. The Royal Bank of Scotland N.V., established in Amsterdam, The Netherlands. Registered with the Chamber of Commerce in The Netherlands, No. 33002587. Authorised by De Nederlandsche Bank N.V. and regulated by the Authority for the Financial Markets in The Netherlands. Agency agreements exist between different members of The Royal Bank of Scotland Group plc.
© Copyright 2024 The Royal Bank of Scotland plc. All rights, save as expressly granted, are reserved. This communication is for the use of intended recipients only and the contents may not be reproduced, redistributed, or copied in whole or in part for any purpose without The Royal Bank of Scotland plc’s prior express consent.
|
|
|