If you cannot see the graphic or access the links within this message please go to the source
|
 |
The most cyclical sector of all looks primed for next upswing
Investing in the Central London Office market has always been a matter of timing. Get it wrong and losses can be quick and very painful. Get it right however and returns typically outperform other commercial property sectors. The bull market of the late 80’s saw Central London office values double, well ahead of any other sector, before they halved again in the bear market of the early 90’s.
In the subsequent recovery, values grew by 60%, stronger than almost any other sub-sector. In the mid-2000’s Central London office values rose at almost twice the rate of Retail or Industrial values, before crashing back to earth again during the Global Financial Crisis.
Yet once again their subsequent rebound outstripped other sectors, growing by 115% over six years, compared to a comparatively pedestrian 39% for Industrial and 33% for Retail.
Across the 45-year history of the MSCI Annual Index, Central London offices have delivered stronger capital growth in the upcycles: 10.3% per annum, compared to 9.3% for Industrial, 7.7% for Retail and 7.1% for regional offices. This has been matched by underperformance in down years: -10.2% per annum, compared to -8.3% for Retail, -8.0% for Industrial, and -7.5% for Regional Offices. |
In the most recent downcycle, Central London office values have dropped by 22% on average. Yet there are good reasons to believe that the sector may once again prove to be a good sector to target in the early phase of the next cycle. Unlike in previous cycles there was no excessive spike in development, and therefore the increase in vacancy has been less extreme.
This has been concentrated in older and more fringe assets which becomes a stock selection issue rather than a sector-wide one. Even as capital values have declined, average rental values have risen by more than 10%, and prime rents are up by considerably more than that. A sector that is yielding above its long-term average, and delivering consistent rental growth, looks well placed to outperform. |
|

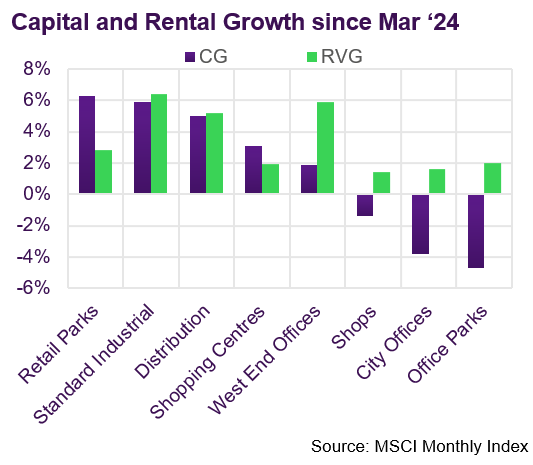
Commercial property returns
According to MSCI, average commercial property values edged upwards by 0.1% again in May, taking the cumulative recovery to 2.7% since this time last year. However, the trend rate of growth has dropped, from 1.5% in Q4 last year to just 0.5% over the last 3 months. Values are on average still 23% below their June ’22 peak.
The strongest recovery to date has come from the Standard Industrial sub-sector, where values are up by 7.5% since they bottomed out in February last year. Distribution Warehouse values have also recorded robust growth, up by 6.2% over the same period. Both sub-sector trends are well supported by rental growth (+5.6% and +4.6% YOY respectively).
Retail sub-sectors have seen varying degrees of recovery. Retail Parks have been the top performer with capital growth of 6.9% since Feb ’24, albeit the recovery seems to have lost some steam in recent months. Shopping centre values have edged up by 3.1% over the last 12 months, whilst shop values still seem to be bumping along the bottom.
Most office regions have seen no recovery at all to date, with Outer London offices and office parks seeing further value declines so far this year (-2.5% and -3.3% respectively). Exceptions to this trend are the West End and Eastern England (dominated by Cambridge) where values have risen by 2.7% and 1.5% respectively within the last 6 months. |
Investment market activity
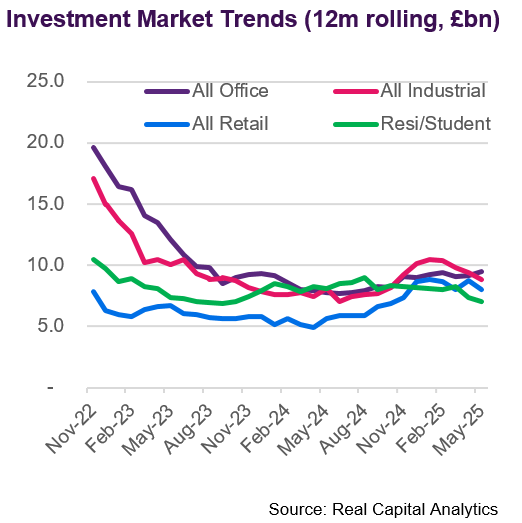
Preliminary data from Real Capital Analytics indicate that £3bn of transactions completed in May. This continues a gradually improving trend over recent months, but still reflects an unusually slow market. The YTD total of £14.0bn is around 25% below the same period last year and less than half the total from the same period in 2022.
The largest deal to close in May was a £340m investment by Greykite for their pan-European logistics platform, Silverdock. The underlying transactions were reported to include an eight-asset portfolio acquired from Logicor and four assets acquired from Hines. These deals follow an initial €350m portfolio acquisition from Logicor in November.
The shopping centre market has recently been notable for part-owners buying out their JV partners. The latest involved by British Land, who took full control of Brent Cross through the acquisition of the Aberdeen UK Shopping Centre Trust. The net cash consideration of £186m reflects a 16% discount to Dec ’24 book value and an 8.6% yield.
The JV between Aware Super and Delancey closed two notable London West End office deals in May. They acquired 11-12 Hanover Square for £170m, £10m ahead of the asking price and reflecting a sub-4% net initial yield. They also completed on Lazard’s new HQ at 20 Manchester Square from Invesco Real Estate for £120m, a 5.2% yield.
A few sizeable Retail deals in May included the £50m purchase by Praxis of the St Enoch centre in Glasgow. The sale, instigated by the lenders to previous owner Blackstone, reflects a value of £70/sq ft, compared to £265 when Blackstone acquired it in 2013, and £507 when traded in 2006. |
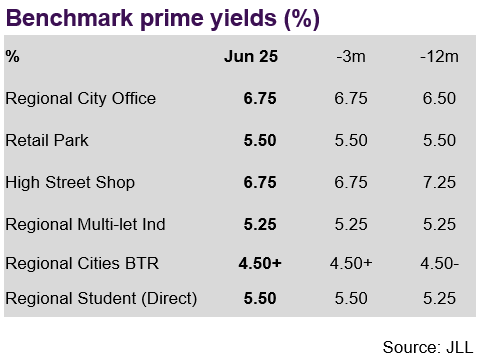
Market yields
Despite the rapidly evolving situation in the Middle East, the benchmark ten-year Gilt has come in over the last month. At the time of writing the yield is just over 4.5%, almost back where it was at the start of the year. The five-year swap rate has been broadly stable around 3.7-3.8% range, reflecting expectations that base rate will continue to trend down by 25bp per quarter.
JLL made no changes to their yield benchmarks over the last month. However, they marked the West End Offices >£125m benchmark as trending Stronger, indicating expected compression from 4.5% currently - perhaps inspired by the £170m sale of 11-12 Hanover Square at a sub-4% yield. The >£125m City Office benchmark is also expected to come in from 5.75%.
In contrast, the six Industrial benchmark yields, which JLL had for some time flagged as trending Stronger, have now been downgraded to Stable. The benchmarks which range from 4.75% in London to 5.25% in regional markets outside the South East, have been unmoved over the last year perhaps reflecting a broad consensus on where fair value is in the sector.
JLL perceive that prime BTR benchmarks have slightly softened over the last year, perhaps reflecting the slowdown in rental growth from the exceptional levels recorded in recent years. Although these are now deemed to be stable, it is notable that the monthly rate of investment in the sector this year has been a third lower than it was last year. |
Auctions
Allsop’s Commercial auction in June raised £24m from the sale of 40 lots. The success rate of 82% was a strong result, but nonetheless the low sales proceeds continue a trend for relatively low numbers this year. The sum total of proceeds from Allsop’s last three commercial auctions (£111.2m) is 40% down on the equivalent auctions last year.
Assets combining commercial income and residential development potential are perennially popular, and this was reflected in the highest value sale of the day. A grade II listed corner block in Leeds, with a lease to Wagamama on the ground floor and vacant offices above, sold for £3m (6% initial yield). |
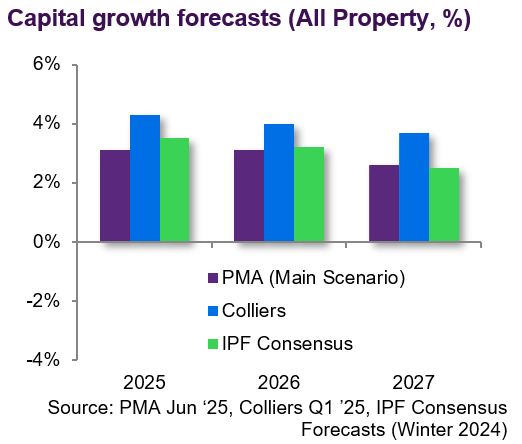
Market forecasts
Independent forecasters PMA published their latest forecasts in June. On a total return basis, returns over the next five years are expected to be stronger than at any time since 2013. The total return (income return plus capital growth) is forecasts to be 8.1% this year and 7.1% p.a. over the five-year horizon.
The Industrial sector is expected to outperform over 5 years on both a capital growth basis (3.4% p.a.) and total return basis (7.9% p.a.). The capital growth will be well underwritten by 2.8% p.a., with only moderate yield compression anticipated. Capital growth is expected to be slightly stronger for standard industrial (4.0% p.a.) than distribution warehouses (2.7% p.a.).
Total return forecasts for the Retail sector largely reflect an income return, ranging from 6-7%. Central London Retail and the biggest shopping centres are expected to deliver the strongest returns, whilst small-town high street retail and secondary shopping centres are expected to underperform.
PMA present a bullish set of forecasts for Central London Offices, predicting total returns of 7.5% p.a. This is expected to include capital growth of 3.3%, fully underwritten by rental growth of 3.9%. In contrast, regional office values are expected to remain soft, with total returns of c4.5-5.5% p.a. |
|
Looking forward
Most responsible investment propositions come with the following pieces of sensible advice: “Prices can go down as well as up”, and “past performance is no guarantee of future results”. Both are self-evidently true, and the first is probably more true of Central London Offices than most other real estate investment. The second is of course a truism, but it shouldn’t distract from the fact that commercial property is inherently and reliably cyclical. The higher prices rise, the harder the fall will eventually be. But conversely, once prices have corrected, downside risk is reduced and the foundations for the upward leg of the next cycle is laid.
Independent forecasters PMA, who are not known for getting giddy with over optimism, are predicting 18% capital growth on average for the Central London sector within the next 5 years. They expect this to drive total returns (including income) of 7.5% per annum over that period. Given that this includes older and less well-located assets which are likely to underperform, the performance of better quality assets should be expected to exceed the average. What’s more, these forecasts do not require heroic assumptions on yield compression. PMA have predicted that yields will harden by just 30bp or so, not unreasonable given their starting position and the anticipated downward trend in interest rates. Rather, capital growth is expected to be driven by steady rental growth and a gradual reduction in voids, contributing to a very healthy 4.5% per annum of income growth.
Forecasts are just that, but past cycles show that buying Central London offices after three years of declining values can pay off handsomely. Cycles may all be different, but they share many common elements. In the words attributed to Mark Twain “History doesn’t repeat itself but it often rhymes”. |
Visit us
Discover a wealth of
real estate expertise, regardless of your business level or stage.
 |
|
|
If you would like to opt out, please get in touch with your Relationship Manager.
This document has been prepared by National Westminster Bank Plc or an affiliated entity (“NatWest”) exclusively for internal consideration by the recipient (the “Recipient” or “you”) for information purposes only. This document is incomplete without reference to, and should be viewed solely in conjunction with, any oral briefing provided by NatWest. NatWest and its affiliates, connected companies, employees or clients may have an interest in financial instruments of the type described in this document and/or in related financial instruments. Such interests may include dealing in, trading, holding or acting as market-maker in such instruments and may include providing banking, credit and other financial services to any company or issuer of securities or financial instruments referred to herein. NatWest is not and shall not be obliged to update or correct any information contained in this document. This document is provided for discussion purposes only and its content should not be treated as advice of any kind. This document does not constitute an offer or invitation to enter into any engagement or transaction or an offer or invitation for the sale, purchase, exchange or transfer of any securities or a recommendation to enter into any transaction, and is not intended to form the basis of any investment decision. This material does not take into account the particular investment objectives, financial conditions, or needs of individual clients. NatWest will not act and has not acted as your legal, tax, regulatory, accounting or investment adviser; nor does NatWest owe any fiduciary duties to you in connection with this, and/or any related transaction and no reliance may be placed on NatWest for investment advice or recommendations of any sort. Neither this document nor our analyses are, nor purport to be, appraisals or valuations of the assets, securities or business(es) of the Recipient or any transaction counterparty. NatWest makes no representation, warranty, undertaking or assurance of any kind (express or implied) with respect to the adequacy, accuracy, completeness or reasonableness of this document, and disclaims all liability for any use you, your affiliates, connected companies, employees, or your advisers make of it. Any views expressed in this document (including statements or forecasts) constitute the judgment of NatWest as of the date given and are subject to change without notice. NatWest does not undertake to update this document or determine the accuracy or reasonableness of information or assumptions contained herein. NatWest accepts no liability whatsoever for any direct, indirect or consequential losses (in contract, tort or otherwise) arising from the use of this material or reliance on the information contained herein. However, this shall not restrict, exclude or limit any duty or liability to any person under any applicable laws or regulations of any jurisdiction which may not be lawfully disclaimed. The information in this document is confidential and proprietary to NatWest and is intended for use only by you and should not be reproduced, distributed or disclosed (in whole or in part) to any other person without our prior written consent.
National Westminster Bank Plc. Registered in England & Wales No. 929027. Registered Office: 250 Bishopsgate, London EC2M 4AA. National Westminster Bank Plc is authorised by the Prudential Regulation Authority, and regulated by the Financial Conduct Authority and the Prudential Regulation Authority.
|
|
|