If you cannot see the graphic or access the links within this message please go to the source
|
 |
BTR market favouring investors with a long-term perspective
Build-to-Rent (BTR) has been one of the true success stories of the last decade in the UK real estate market. From an almost standing start, the sector has grown at a remarkable pace.
According to Savills data, the sector delivered 18,000 new rental homes last year, representing 8% of all new-build completions across England and Wales.
Savills report that 127,000 homes were operational as at the end of Q1, and that a further 50,000 units are currently under construction. Investor demand for the sector has seemed insatiable, with a new record level of investment set in 2024, around £5bn committed.
However, not everything in the garden is rosy, with new starts in 2024 22% lower than the annual average over the preceding 5 years. This picture seems particularly subdued for multi-family, with anecdotal evidence suggesting that the pipeline of new schemes getting financed is well down on last year. |
This slowdown appears to reflect a diverse range of factors including elevated build costs, rigorous regulatory requirements, volatile medium-term interest rates and slowing rental growth, all of which conspire to make viability more challenging. The truth is that whilst investors remain keen to increase their allocations to BTR, the combination of a higher risk-free rate and lower rental growth makes it harder to get the numbers to stack up than it seemed a year ago. For three years following the pandemic, high single-digit or even double-digit year-on-year rental growth helped most schemes to comfortably deliver on business plans even if build costs were higher than expected.
According to Cushman & Wakefield, BTR rental growth slowed to 3.5% year-on-year, and broader PRS rental growth of just 1.2% suggests that it may slow further still. This puts a lot more pressure on cost control, focusses attention on let-up periods and occupancy assumptions, and increases risk materially for investors with a strategy to flip assets on as soon as they have stabilised. |
|
Commercial property returns
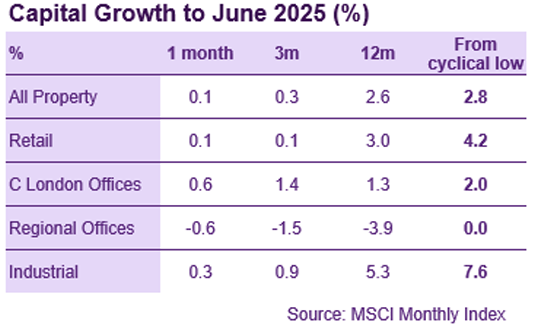
According to MSCI, average commercial property values edged upwards by 0.1% again in June, taking the cumulative recovery to 2.8% since last Spring. However, the trend rate of growth has slowed steadily, from 1.5% in Q4 last year to just 0.3% over the last 3 months. Values on average are still almost 23% below their June ’22 peak.
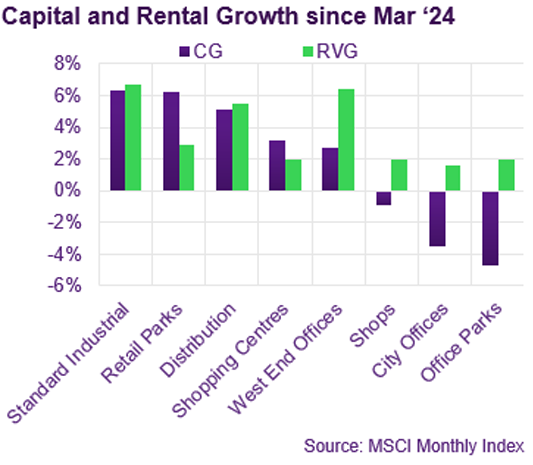
The rate of capital growth in the Industrial sector has slowed but remains firmly positive. Standard Industrial values are up by 2.0% YTD, and by 8.0% since February last year. Distribution Warehouses are not far behind, up by 1.5% YTD and by 6.5% overall. Both sub-sector trends are well supported by rental growth (+1.7% and +1.9% YTD respectively).
However, the strongest capital growth so far this year has come from West End Offices, up by 2.7% YTD. This capital appreciation has been driven by rental growth (+3.8% YTD). City Offices have also delivered rental growth this year (+1.3%), but this hasn’t yet translated into capital growth. Outer London has been the weakest office market this year, with capital values down by 3.7% despite some modest rental growth.
Most retail formats are now recording moderate levels of capital growth; supermarkets, shops and in-town shopping centres all delivered 1.2% in the first half of the year. Capital growth for Retail Parks has slowed markedly, from 3.5% in H2 ’24 to just 0.7% in H1 this year. |
Investment market activity
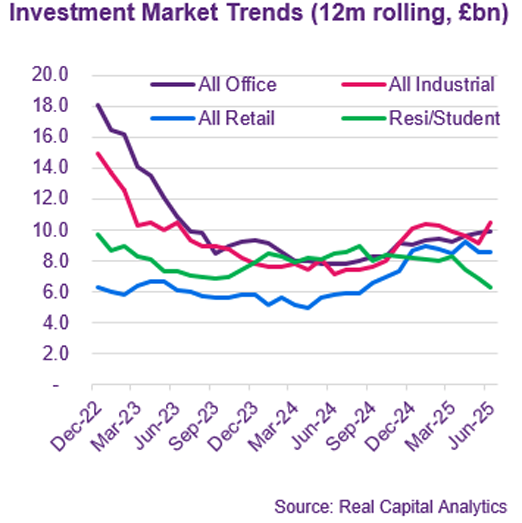
Preliminary data from Real Capital Analytics indicate that £4bn of transactions completed in June. This represents the strongest month of the year so far, continuing a steadily improving trend after a very slow start. The YTD total of £18.3bn is now in line the same period last year, albeit still less than half the total from the same period in 2022.
The largest deal to close in June was the c£700m purchase of Urban Logistics REIT by LondonMetric. The combined entity has a portfolio valued at over £7bn, just over half of which is logistics. The price, a mix of cash and shares, represented a 21.8% premium to the undisturbed share price, but a marginal discount to the EPRA NTA value.
The largest single-asset transaction to close in June was the sale by Barings of Capital House, on King William Street in the City, to a Japanese investor for £169m. The buyer is a subsidiary of Mitsui OSK Lines which will occupy part of the office as its European HQ. Barings reportedly invested £11m in the asset since acquiring it for £130m in 2021.
Two notable regional city office deals completed in June. Melford Capital acquired 101 Embankment in Manchester for £75m. The vendors, a JV led by M&G, acquired the asset in 2017 for £104m. In Birmingham, Hermes sold Baskerville House for £37.7m. They had owned the Grade II listed office on Centenary Square since 2012, when they bought if for £40.5m.
After a strong couple of years, “beds” sector deals have been in relatively short supply so far in 2025. However, the student accommodation sector is still ticking over, with the 393-bed Spring Mews in Vauxhall acquired by a JV between Barings and Rosethorn Capital for £101m. |
Market yields
The benchmark ten-year Gilt yield moved out over the last month against a backdrop of concerns over the government’s ability to reduce the deficit. At the time of writing the ten-year yield was close to 4.7%, almost 50bp higher than the same time last year. In contrast, the 5-year Sonia swap has been broadly flat over the last month and is still marginally lower than a year ago.
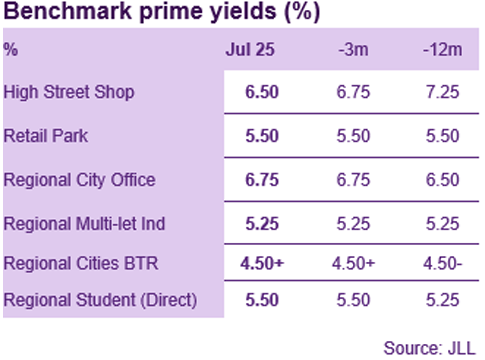
JLL only made one change to their benchmark yields in the last month. The prime high street retail yield came in by 25bp to 6.5% and is expected by JLL to harden further from here. The prime benchmark has already firmed up significantly, from 7.25% less than 12 months ago, although it is not clear what transactional evidence underpins the trend.
Most commercial sub-sector benchmarks appear to be in a holding pattern, deemed by JLL to be stable at their current levels. Notable exceptions are larger Central London office lots, where ongoing deals suggest some compression, and prime leased hotel benchmarks which are also expected to firm up (currently 4.5% in London and 5.25% in the regions).
JLL perceive that prime BTR benchmarks are stable, ranging from 4.25% for Inner London to 5.0% for secondary regional locations. However, it is notable that the monthly rate of investment in the sector has slowed dramatically this year. With the benchmark ten-year Gilt yield at c4.7%, there is a heavy reliance on persistent rental growth to deliver required returns. |
Auctions
Allsop’s Commercial auction in July raised £26.9m from the sale of 53 lots, reflecting a moderate success rate of 75%. Total sales so far this year are down on 2024, but the overall success fate has remained consistent at 85%. The highest price achieved was £3.1m, for a retail parade with residential above in Aintree, reflecting a net initial yield of 9.4%.
In contrast, an office in Sutton failed to achieve a sale at the guide price of £3.75m, despite offering a 13% yield via income from accountancy firm Mazars and serviced office operator Spaces. The modern office space is rated BREEAM Excellent but shares the building with a separately owned hotel. |
Market forecasts
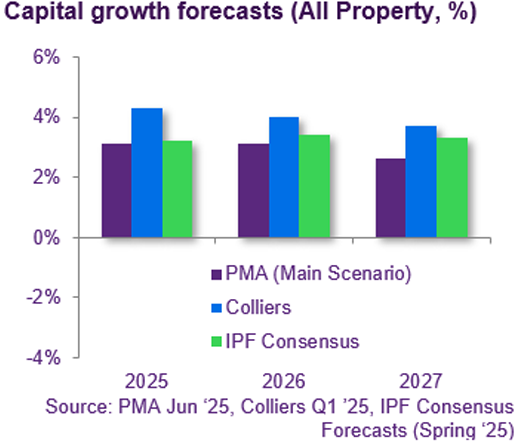
The latest IPF Consensus forecast, published in May, predicts steady growth in capital values over the next five years. The mean forecast of all contributors was for 3.2% growth this year, followed by a further 3.4% next year. Over the five-year horizon capital values are expected to rise by 3% per annum, and this is expected to be well underwritten by rental growth of 2.7% p.a.
The Industrial sector is still expected to outperform over 5 years on a capital growth basis (3.8% p.a.), supporting a very healthy annualised total return of 8.4% p.a. Rental growth is expected to slow further from the heady levels of recent years, but is nonetheless predicted to deliver 3.2% p.a. over 5 years.
On a total return basis, the Industrial sector is for the first time in many years expected to be pushed into second place, by Shopping Centres. The much-maligned sector is expected to deliver 8.5% p.a., driven almost entirely by income, alongside a dash of rental growth. Retail Warehouses are expected to be a close third with a predicted five-year total return of 8.3% p.a.
The office sector is forecast to deliver a more moderate, but still healthy, total return of 6.5% p.a. over 5 years. For regional offices this is likely to be purely derived from income, whereas Central London markets are expected to deliver capital growth of c2.5% per annum, driven entirely by rental appreciation. |
Looking forward
Whilst, it has undoubtedly become more challenging to make the numbers stack up on new schemes, the long-term fundamentals for the sector remain compelling. From a demand perspective, first-time buyers are having to wait longer than ever to get on the housing ladder, extending their time in the rental market. From a supply perspective, the rapid growth in BTR has been more than netted off by the decline in small Buy to Let investors, with far fewer new investors entering the market. Affordability may be getting stretched for premium product in certain locations, but average earnings have increased by almost 20% over the last three years, underwriting a very significant part of BTR rental growth over the same period. This growth is almost certainly going to be slower over the next three years, and there may be periods where rents do not grow at all. However, in the long-run there is a very high correlation between nominal earnings growth and rental growth, so the sector should continue provide an attractive level of inflation hedging.
The challenge for investors with a shorter-term horizon is that not only is there less rental growth during construction, but the new build premium also seems to be fading faster for multi-family schemes. Anecdotal evidence suggests that occupancy levels are dropping off within 3-4 years of completion. We are are still talking about occupancy rates in the low 90’s, which most sectors would bite your arm off for, but BTR valuations have typically been predicated on 97-98%. Single-family may be less exposed to these trends, perhaps explaining why investment in the sub-sector exceeded multi-family for the first time in Q2, but it’s very early days to draw clear conclusions.
The UK BTR sector remains well-placed for growth, but recent trends highlight that whilst long-term fundamentals are sound, investors with a short-term horizon remain exposed to the inherent fluctuations of the real estate market. |
Visit us
Discover a wealth of
real estate expertise, regardless of your business level or stage.
 |
|
|
If you would like to opt out, please get in touch with your Relationship Manager.
The Royal Bank of Scotland plc, The Royal Bank of Scotland N.V, or an affiliated entity (‘RBS’) and for the purposes of Directive 2004/39/EC has not been prepared in accordance with the legal and regulatory requirements to promote the independence of research. Regulatory restrictions on RBS dealing in any financial instruments mentioned at any time before this document is distributed to you do not apply. This document has been prepared for information purposes only. It shall not be construed as, and does not form part of an offer, nor invitation to offer, nor a solicitation or recommendation to enter into any transaction or an offer to sell or a solicitation to buy any security or other financial instrument. No representation, warranty or assurance of any kind, express or implied, is made as to the accuracy or completeness of the information contained herein and RBS and each of their respective affiliates disclaim all liability for any use you or any other party may make of the contents of this document. The contents of this document are subject to change without notice and RBS does not accept any obligation to any recipient to update or correct any such information. Views expressed herein are not intended to be and should not be viewed as advice or as a recommendation. RBS makes no representation and gives no advice in respect of any tax, legal or accounting matters in any applicable jurisdiction. This document is not intended for distribution to, or use by any person or entity in any jurisdiction or country where such distribution or use would be contrary to local law or regulation. The information contained herein is proprietary to RBS and is being provided to selected recipients and may not be given (in whole or in part) or otherwise distributed to any other third party without the prior written consent of RBS. RBS and its respective affiliates, connected companies, employees or clients may have an interest in financial instruments of the type described in this document and/or in related financial instruments. Such interest may include dealing in, trading, holding or acting as market-makers in such instruments and may include providing banking, credit and other financial services to any company or issuer of securities or financial instruments referred to herein. The Royal Bank of Scotland plc. Registered in Scotland No. 90312. Registered Office: 36 St Andrew Square, Edinburgh EH2 2YB. The Royal Bank of Scotland plc is authorised by the Prudential Regulation Authority and regulated by the Financial Conduct Authority and Prudential Regulation Authority. The Royal Bank of Scotland N.V., established in Amsterdam, The Netherlands. Registered with the Chamber of Commerce in The Netherlands, No. 33002587. Authorised by De Nederlandsche Bank N.V. and regulated by the Authority for the Financial Markets in The Netherlands. Agency agreements exist between different members of The Royal Bank of Scotland Group plc.
© Copyright 2024 The Royal Bank of Scotland plc. All rights, save as expressly granted, are reserved. This communication is for the use of intended recipients only and the contents may not be reproduced, redistributed, or copied in whole or in part for any purpose without The Royal Bank of Scotland plc’s prior express consent.
|
|
|