If you cannot see the graphic or access the links within this message please go to the source
|
 |
Budget anxiety saps momentum from typical year-end push
The last quarter of the year can usually been relied upon to deliver a surge in investment activity, as investors push to get deals over the line and set their portfolios up for the following year.
At first glance, the headline data suggests that a good start was made in October, with £6bn of transactions making it the strongest month of the year so far. However, half of that figure related to a single corporate merger involving two healthcare REITS.
The mainstream investment market remains as it has for most of the year, with a smattering of sizeable transactions but little in the way of broad-based price discovery.
Conversations with a wide range of investors and developers, particularly those investing private capital, have revealed a reluctance to commit to decisions amongst the endless stream of leaks, rumours and journalistic mischief making ahead of the budget.
Yet with the budget now finally behind us, there is little time left for any renewed activity before year-end, even from those who come away from it feeling confident enough to proceed. |
As for the budget itself, amongst the blizzard of measures there were of course some that will impact the property market either directly or indirectly, but none that should dramatically change the outlook for commercial property investment. There was certainly nothing in there to compare to the abolition of upwards-only rent reviews, the announcement of which pre-dated the budget.
However, private residential investors, still digesting the implications of the the Renters Rights Act, will not welcome the extra 2% income tax on rental income which has seemingly been characterised as “unearned”. Higher-value residential properties will also now be subject to a significant council tax surcharge, a measure which seems likely to further slow transactions at the top end of the market, much to the dismay of developers in that space.
Looking through a broader lens, the key for the longer term is the perception of the UK as both a stable environment and a rewarding place to invest. On the former, the bond market’s immediate reaction seemed to reflect guarded approval of the notional increase in fiscal headroom, but we will likely have to wait until the New Year to judge real estate investors’ verdict on the latter. |
|
Commercial property returns
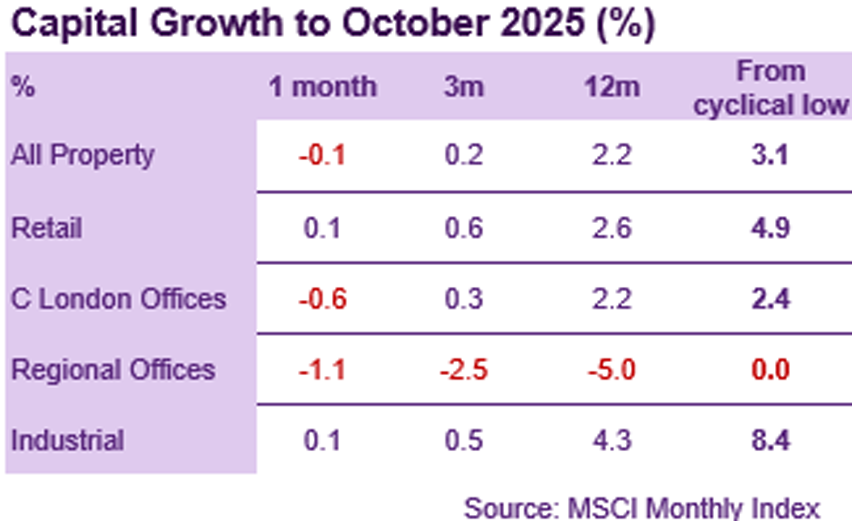
According to MSCI, average commercial property values dropped by 0.1% in October, the first negative reading for 14 months. On average, capital values have increased by 3.1% from their cyclical low, but are still, on average, 22.7% below the preceding cyclical peak.
The average decline was driven by the Office sector which saw values fall by 0.9% month-on-month. The sharpest falls have been in the South East; down 2.0% in October and by 41.4% since June ’22. More surprising was the 0.6% drop in Central London office values, following a run of monthly gains. The decline reflects an outward shift in valuation yields rather than a drop in rental values, which have been edging up in most regions.
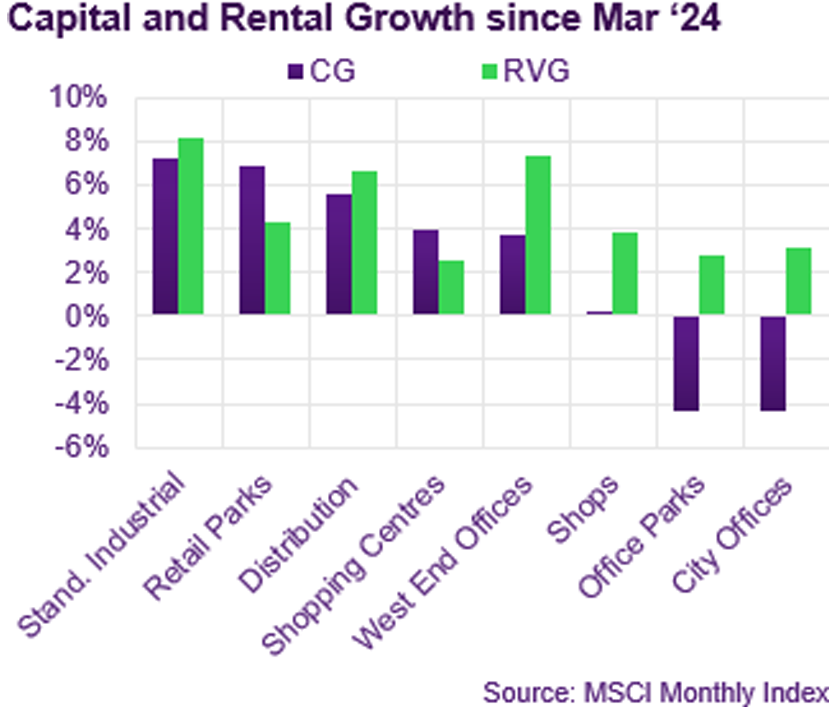
The Industrial sector is still recording capital growth, but at a much-reduced rate. Values have risen by 2.6% YTD, backed up by solid rental growth of 3.3%. Standard Industrial has outperformed YTD, with capital growth of 2.9% vs 1.9% for Distribution, and rental growth of 3.5% vs 3.0%.
Retail values continue to edge up very gradually, with 0.1% capital growth in October taking YTD growth to 1.4%. This has been fully underwritten by rental appreciation of 2.0%. This slow but steady rate of capital and rental growth appears to be broadly consistent across Retail formats. |
Investment market activity
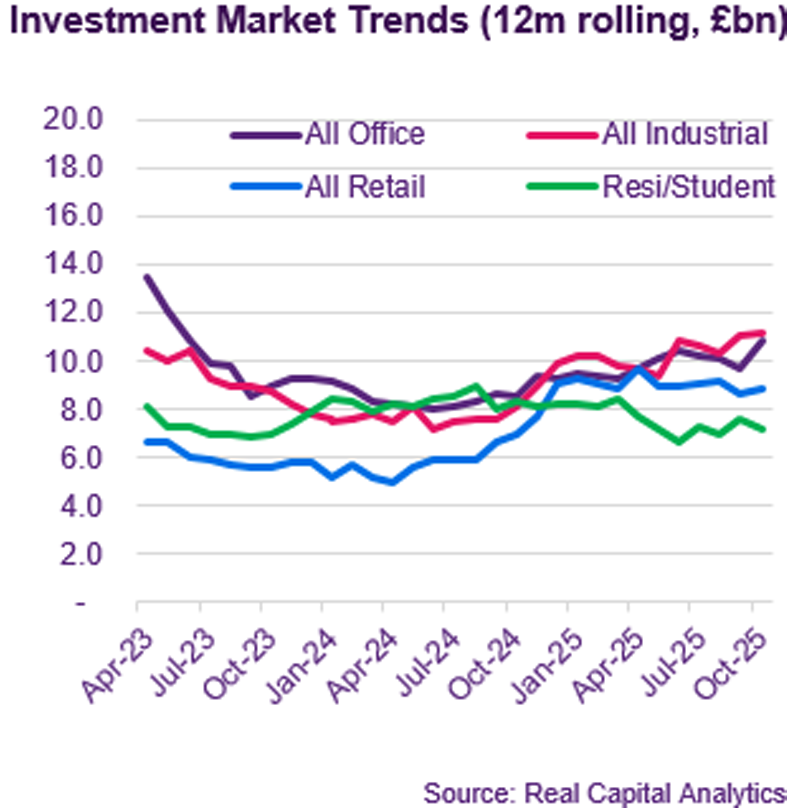
Preliminary data from Real Capital Analytics suggest that October was by far the strongest month for investment so far this year. However, the £6.1bn total was inflated by the takeover of Assura by PHP. RCA data reflects the £3.1bn gross value of Assura’s portfolio of GP surgeries. That transaction aside, the £3bn monthly total was in line with trend.
Another large scale and unusual deal impacted on the figures for October. Oracle founder Larry Ellison committed £890m to expand his technology institute in Oxford. The investment will extend the Oxford Science Park deliver a 2m sq ft complex that can accommodate up to 7,000 staff. Previous plans unveiled in 2023 were to deliver 300,000 sq ft on the site.
Continuing a recent trend for recapitalisations, Sixth Street and Clipstone Investment Management have seeded a new JV by hiving off a £350m portfolio from Clipstone Industrial REIT, a Guernsey-listed entity. The portfolio comprises 37 estates located in the South East.
Two sizable London office deals closed in October. Royal London Asset Management acquired 1 Newman Street, which includes retail frontage on Oxford Street, from GPE for £250m, a yield of circa 4.5%. In the City, Turkish developer Enka bought Park House on Finsbury Circus for £186m.
Two significant but contrasting mixed-use London assets traded in October. Mago Capital acquired the majority of the Notting Hill Gate Estate from a JV between Frogmore and Morgan Stanley for £125m, reflecting a yield of 6.5%. The estate comprises three buildings and accommodates a range of retail and office tenants across 145,000 sq ft. Elsewhere, Aberdeen acquired 2-5 Old Bond Street for £120m, a yield of 3.5%. |
Market yields
Market expectations for further rate cuts seem to have been brought forward by the latest inflation data. Strangely, this happened even though inflation had been expected to slow by more than it did. At the time of writing the five-year SONIA swap was priced at 3.6%, with the curve implying a high likelihood of a December cut, and a terminal rate of 3.5% by mid-2026.
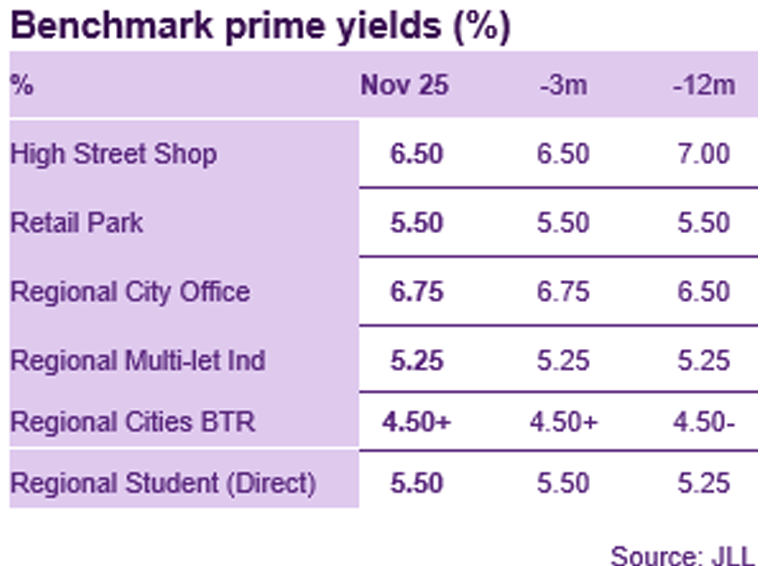
The latest property yield sheet from property adviser JLL, continues to show very little momentum on yields in either direction. The only change since last month is that the agency now perceives that the secondary Retail Park benchmark yield is expected to soften from its current level of 7.0%.
In contrast, JLL continue to expect prime benchmarks for larger lot-size Central London office assets to move in. The £125m sale of 1 Newman Street, reflecting a yield of 4.5%, would appear to lend some weight to this. However, the picture is muddied by the mixed-use nature of the asset, with a significant element of Oxford Street-fronting retail included alongside the office element.
JLL perceive that Build-to-Rent benchmarks remain stable, ranging from 4.25% in Inner London to 4.5% for prime regional assets. However, anecdotal evidence would suggest that where trades are happening these are happening at yields of 5%+. This may reflect idiosyncratic issues around the assets being traded, but there is little clear evidence of sub-5% activity. |
Auctions
Following their auction in September, which was the largest for 3 years, Allsop’s commercial auction in November was a more modest size. 87 lots were listed, of which 66 were available on the day. 50 assets achieved a sale, raising total proceeds of £31.8m, little more than half of the equivalent auction last year.
The highest price achieved was £2.5m for two large retail units on the Isle of White let to TK Maxx and Mountain Warehouse. The price reflected a yield of almost 14% and a value of circa £42 / sq ft. Trade counter and convenience retail units proved popular with investors, including a Tesco in Maidenhead sold with 7 years on the lease for £1.57m (5.4% net initial yield). |
Market forecasts
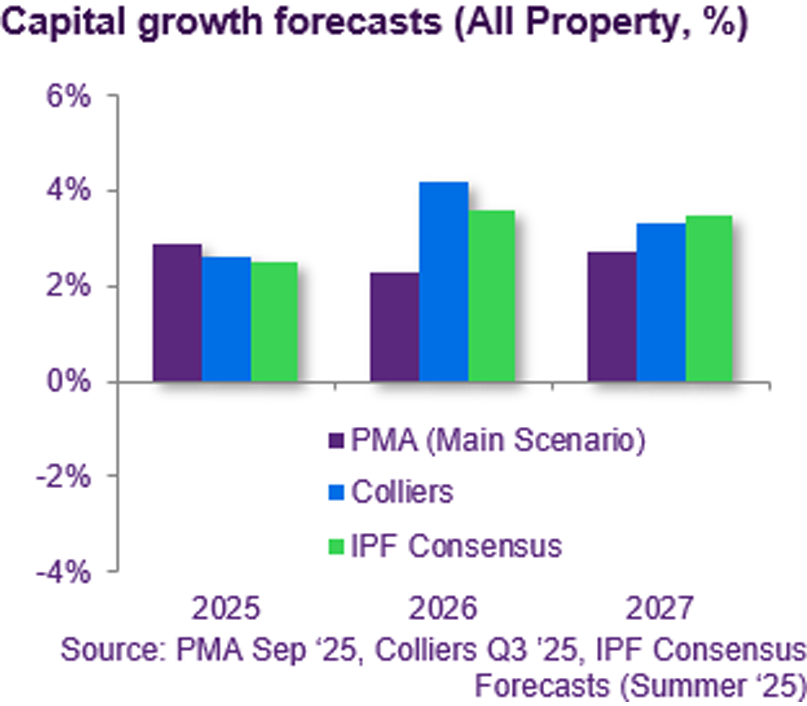
The latest commercial property forecasts published by property adviser Colliers predict an increase in the rate of capital growth, from a projected 2.6% this year to 4.2% in 2026. Over the five years from 2025 to 2029, Colliers anticipate 2.8% p.a. capital growth, supported by 2.6% p.a. rental growth.
Colliers expect that the Industrial sector will continue to outperform, with capital growth picking up from 3.1% this year to 3.7% next. They expect this to be supported by rental growth of 3.3% next year (down from 3.7% in 2025). Slightly slower growth in later years is expected to add up to 2.9% capital growth p.a. from 2025 to 2029, fully underwritten by rental growth of 3.5% p.a.
The Retail sector is predicted to outperform on a total return basis, with a high income return and moderate capital growth (2.4% p.a.) supporting a total return of 8.6% p.a. over the five-year period. Colliers expect shopping centres to be the top performing sector of all on this basis, with a total return of 10.8% p.a., despite only moderate rental growth of 1.7% p.a.
The outlook for offices looks benign at a market-average level, with capital growth of 2.8% p.a. supported by 2.2% p.a. rental growth. However, total return forecasts at a regional level paint a very mixed picture, with London West End predicted to deliver 7.2% p.a., whilst Outer London is expected to deliver a total return of just 5.0% per annum, implying flat capital values at best. |
Looking forward
Whether the property market recovery finally kicks into gear in 2026 seems largely dependent on two factors. First, will the Bank of England deliver the short-term base rate cuts that money markets are expecting? Inflation is expected to drop back over the coming months due to base effects, which will probably give the MPC enough cover to further reduce rates. This should help to make debt accretive for more sectors, although hedging rates will likely only improve if the MPC delivers more than the two cuts that are currently priced in. The effect will be more meaningful if a fall in base rate is mirrored by a decline in Gilt yields, which will in turn be influenced by perceptions of stability and prospects for growth in the UK economy. Lower Gilt yields will encourage more equity into real assets and will make property yields at current levels look more attractive.
However, the second factor is arguably the key to whether the market looks good value or simply fair value. Will the relatively benign occupier conditions seen this year persist next, despite fiscal retrenchment and forecasts of sluggish economic growth? According to data from MSCI, commercial property rents increased by an average of 3.3% this year, a headline annualised rate that has remained steady for the last couple of years. In fact, the trends behind this headline number offer still more encouragement, given that growth has become more broad-based and less dependent on the Industrial sector. This rental appreciation has come despite persistently tepid economic growth. The main reason for this apparent anomaly has been the shortage of modern space caused by a constrained development pipeline allowing landlords to benefit from broader inflationary trends. A reminder that as a real asset, property investment does offer a genuine upside to returns relative to bonds. |
Visit us
Discover a wealth of
real estate expertise, regardless of your business level or stage.
 |
|
|
If you would like to opt out, please get in touch with your Relationship Manager.
The Royal Bank of Scotland plc, The Royal Bank of Scotland N.V, or an affiliated entity (‘RBS’) and for the purposes of Directive 2004/39/EC has not been prepared in accordance with the legal and regulatory requirements to promote the independence of research. Regulatory restrictions on RBS dealing in any financial instruments mentioned at any time before this document is distributed to you do not apply. This document has been prepared for information purposes only. It shall not be construed as, and does not form part of an offer, nor invitation to offer, nor a solicitation or recommendation to enter into any transaction or an offer to sell or a solicitation to buy any security or other financial instrument. No representation, warranty or assurance of any kind, express or implied, is made as to the accuracy or completeness of the information contained herein and RBS and each of their respective affiliates disclaim all liability for any use you or any other party may make of the contents of this document. The contents of this document are subject to change without notice and RBS does not accept any obligation to any recipient to update or correct any such information. Views expressed herein are not intended to be and should not be viewed as advice or as a recommendation. RBS makes no representation and gives no advice in respect of any tax, legal or accounting matters in any applicable jurisdiction. This document is not intended for distribution to, or use by any person or entity in any jurisdiction or country where such distribution or use would be contrary to local law or regulation. The information contained herein is proprietary to RBS and is being provided to selected recipients and may not be given (in whole or in part) or otherwise distributed to any other third party without the prior written consent of RBS. RBS and its respective affiliates, connected companies, employees or clients may have an interest in financial instruments of the type described in this document and/or in related financial instruments. Such interest may include dealing in, trading, holding or acting as market-makers in such instruments and may include providing banking, credit and other financial services to any company or issuer of securities or financial instruments referred to herein. The Royal Bank of Scotland plc. Registered in Scotland No. 90312. Registered Office: 36 St Andrew Square, Edinburgh EH2 2YB. The Royal Bank of Scotland plc is authorised by the Prudential Regulation Authority and regulated by the Financial Conduct Authority and Prudential Regulation Authority. The Royal Bank of Scotland N.V., established in Amsterdam, The Netherlands. Registered with the Chamber of Commerce in The Netherlands, No. 33002587. Authorised by De Nederlandsche Bank N.V. and regulated by the Authority for the Financial Markets in The Netherlands. Agency agreements exist between different members of The Royal Bank of Scotland Group plc.
© Copyright 2024 The Royal Bank of Scotland plc. All rights, save as expressly granted, are reserved. This communication is for the use of intended recipients only and the contents may not be reproduced, redistributed, or copied in whole or in part for any purpose without The Royal Bank of Scotland plc’s prior express consent.
|
|
|