If you cannot see the graphic or access the links within this message please go to the source
|
 |
Strong finish to 2025 gives hope for long-awaited lift off
The narrative for the UK property market through much of 2025 was one of frustration and delay as investors waited for a series of events to play out before acting. With the budget only happening at the last possible moment, there seemed little hope for a strong finish to the year.
However, the market has for once surprised on the upside, with £5.7bn of transactions closing in December.
This contributed to the strongest quarter since interest rates started their sharp upward trajectory in 2022. The £17.4bn transacted in the final three months of the year may have been padded out by a couple of very sizeable corporate transactions, but the same can be said of many strong quarters in the past, and they were themselves reflective of renewed confidence from investors. In fact, the sector-spread of the largest transactions was unusually broad, with corporate deals in healthcare and single-family supported by a number of sizeable Industrial portfolios as well as hotels, offices, supermarkets and a major shopping centre. |
It should be acknowledged at this point that a similar pattern was observed 12 months ago, with a strong end to 2024, and that did not lead to a sustained recovery in investment activity. The hoped-for rebound in 2025 was snuffed out in its infancy when President Trump announced a wave of punitive trade tariffs in the early days of his second term.
However, whilst it would be a brave strategy to bet against more Trump-inspired chaos (see Greenland), the market is becoming more sanguine about many of his pronouncements given his propensity to row back on most before too long. Most importantly, if there is to be a sustained recovery in investment, it will be built upon the solid foundations of supportive occupier fundamentals and loosening monetary policy.
Although it is obligatory to note that geopolitical conditions are unusually unpredictable, it is very possible that we will look back on the investment rebound of 2026 as being entirely predictable, given the twin dynamics of rental values and interest rates moving in opposite and favourable directions. |
|
Commercial property returns
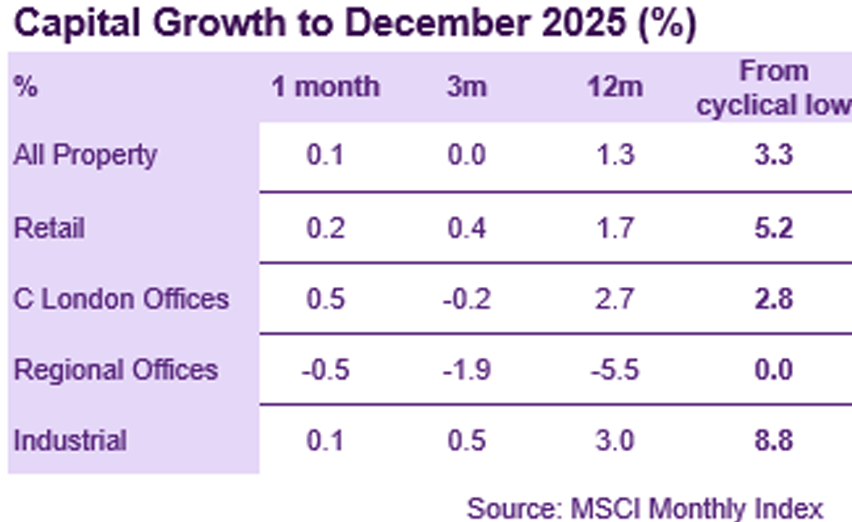
According to MSCI, average commercial property values were flat in the final quarter of 2025, leaving full-year growth at 1.3%. Whilst average values bottomed out in March ’24, they have risen by just 3.3% in the 21 months since, a tepid recovery compared to previous cycles.
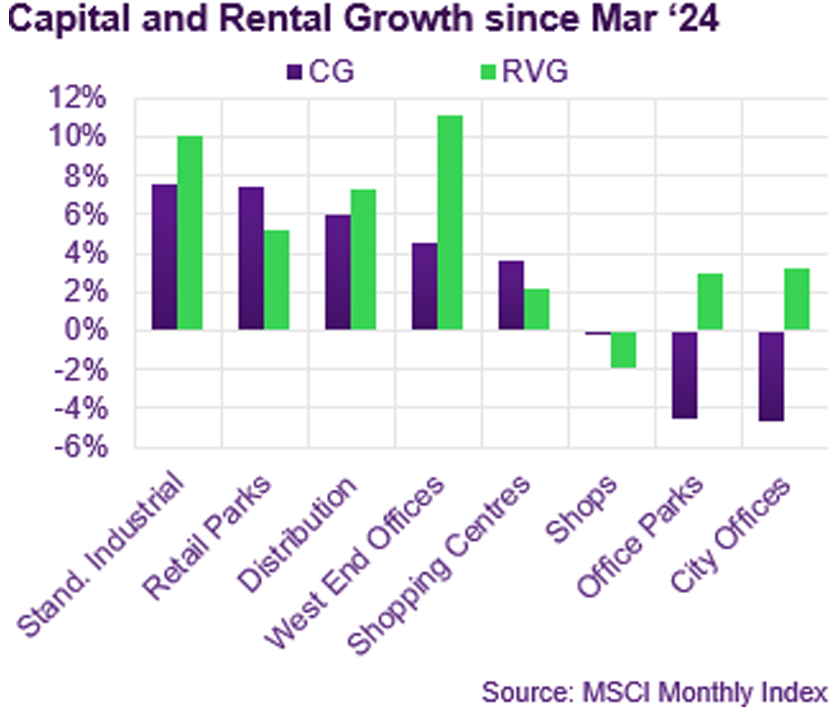
The overall average has been dragged down by the office sector, where asset values declined by 1.2% in Q4 and by 2.3% across 2025. Outer London was the worst performing region in 2025, with values down by 9.9% year-on-year, and by 46% since June ’22. London West End was the only region to buck the trend, with asset values up by 4.5% year-on-year, underwritten by extremely robust rental growth of 8.4%.
Industrial was the top-performing sector for capital growth in 2025 (+3.0%) despite a slowdown in the second half of the year. Rental value growth also slowed but remains robust at an annual rate of 4.7%. Rental growth has been particularly consistent for Standard Industrial assets, delivering at least 5.0% year-on-year in all regions.
It was a steady year for the Retail sector, with the four main formats each delivering between 1% and 2% capital growth. This represented a slowdown for Retail Warehouses but an improvement for other formats versus 2024. Retail values remain on average, 16% below their 2022 peak and are still 36% lower than they were 10 years ago. |
Investment market activity
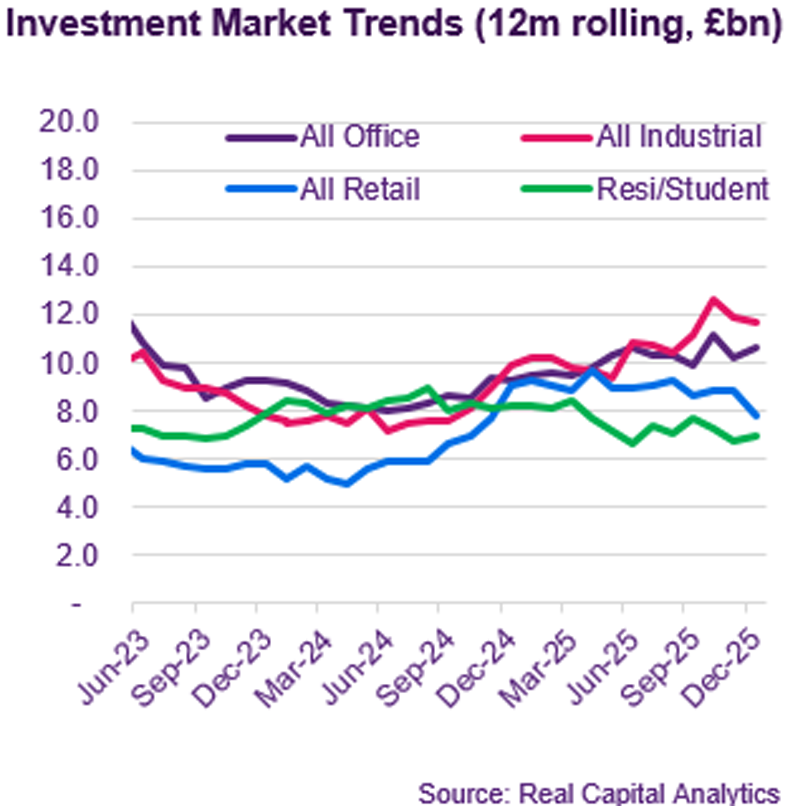
Preliminary data from Real Capital Analytics suggest that 2025 finished on a relatively strong note, with £5.7bn of transactions completing in December. Q4 was the strongest quarter since the first half of 2022 with £17.4bn transacting. The full year total of £48.1bn was only marginally ahead of 2024 but a third higher than the low point in 2023.
The largest deal to close in December was the sale of PRS REIT to a consortium of local authority pension funds advised by Waypoint Asset Management. The acquisition price was £629m, reflecting a 20% discount to the reported portfolio value of £767m. The portfolio comprises of 5,478 single-family rental homes producing an estimated rental value of £73.4m.
Another portfolio trade to complete in December was the €350m sale by Blackstone of logistics assets in the UK and France. The portfolio, which was managed by Blackstone’s MIleway platform, included three assets in Milton Keynes, Leeds and Manchester with an estimated value of £154m.
The largest individual asset to trade in December was Fradley Park distribution estate sold by Ares to Royal London for £198m (£113psf). Ares acquired the 1.75m sq ft park just 2 years previously, from L&G for £141m (£80psf). L&G in turn had acquired the estate in 2014 for £58m (£33psf).
L&G stepped up their PBSA strategy with their first forward-funding deal. They have committed £160m to McLaren Group’s 737-bed scheme on Upper Brook Street in Manchester. The scheme, which is already under construction, is targeting a BREEAM Excellent rating and is due to complete for the start of the 2028/29 academic year. |
Market yields
The quarter-point cut to the base rate in December was almost fully priced in, even though in the end the vote was tighter than some had expected at 5-4. Another cut is expected by Q2 this year, but the market is divided on the likelihood of further cuts after that. Despite geopolitical volatility the 10 year-Gilt yield has been relatively stable at around 4.5%.
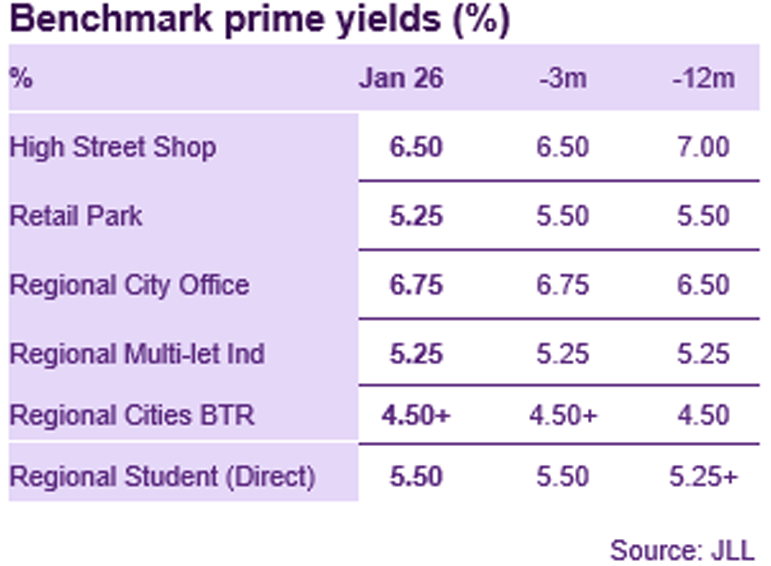
Recent property yield sheets from JLL show little momentum on yields in either direction, with 38 of 49 benchmarks reported to be stable at current levels. This in part reflects the relatively low levels of transactional activity across large parts of the market. Nonetheless, there are a few subtle trends.
Most notably, sentiment for prime Retail appears to be improving. JLL estimate that the prime Retail Park benchmark firmed up by 25bp in December. Notably, the new level of 5.25% is on a par with supermarkets, despite the inflation-linked leases offered by the latter. JLL also perceive that yields are trending stronger for prime high streets and shopping centres.
JLL also perceive that prime benchmark yields for larger Central London office assets are also likely to firm up. They see scope for yield compression amongst the largest City and West End office assets (>£125m) from their current benchmark levels of 5.75% and 4.50% respectively. Both of which represent material pricing discounts relative to smaller and more liquid Central London Office assets. |
Auctions
Allsop’s last auction of the year, held on December 9th was a relatively small one, with £35m raised, compared to £50m in the equivalent auction in 2024. This perhaps reflected the caution resulting from the delayed budget and all the speculation that preceded it. Nonetheless, most of the sellers who did list in the auction were rewarded, with an 87% success rate across the book.
£5.85m of the total was achieved on one lot, a mixed-use commercial asset in Ilford, which sold prior to auction. The asset currently produces a gross yield of just 4% from retail, offices and car parking, but the real value lies in the approval for the development of 56 residential units. Long-term secured income and residential angles remain the most popular aspects for auction buyers. |
Market forecasts
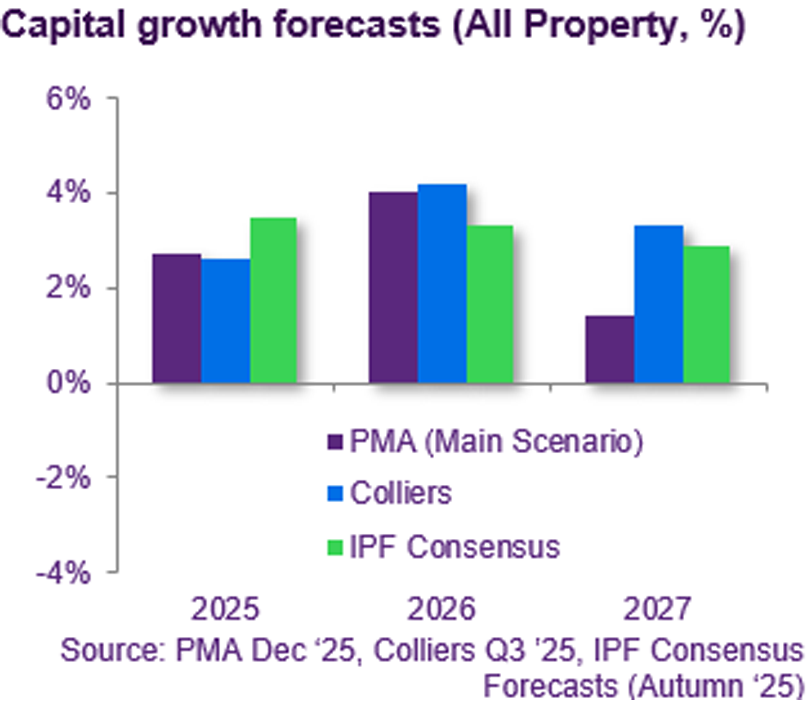
Leading independent forecasters PMA published their latest round of forecasts in December. Despite basing their property market forecasts on consensus economic assumptions of tepid GDP growth, they anticipate healthy capital growth across most property segments in 2026 and over a three-year horizon.
The Industrial sector is expected to continue its long era of outperformance, delivering 11% capital growth by 2028, despite a slowdown in rental growth (+6% over 3 years). Distribution and multi-let industrial and both expected to deliver similarly solid growth, with London outperforming at a regional level.
PMA predict a very mixed picture for the office sector, with robust capital growth in Central London contrasting with softness in most provincial markets. London City is predicted to be the strongest office market, with 3-year capital growth of almost 13%, fully underwritten by rental growth of 14%. In contrast, the M25 West market is expected to see asset values decline by a further 4% by 2028.
The outlook for Retail looks solid if unspectacular from a capital growth perspective, with the notable exception of Central London (+16.8% over 3 years). However, elevated yields are expected to support strong total returns across many retail formats, notably major shopping centres and retail parks. |
Looking forward
The recovery phases in previous cycles have typically been supported by sharp falls in interest rates. The rebound following the early 90’s crash was underwritten by base rate coming down from almost 15% in 1990 to just over 5% by the end of ‘93. Likewise, the post-GFC recovery came against the backdrop of rates being cut hard to a record low of 0.25%. Monetary easing has not been so dramatic in this cycle, but nonetheless a series of cuts from 5.25% to 3.75%, with one or two more still expected, makes a huge difference to leveraged investors. Debt is once again accretive against a wide range of assets, which has typically been a pre-requisite for a sustained recovery in the property market.
The other positive aspect, which sets the current cycle apart from the last two major downturns, is that rental values have been trending upwards across much of the market. Exceptional levels of rental growth in the residential and industrial sectors have been well covered, but there are also encouraging signs if growth across much of the Retail sector and in the strongest office locations. In fact, rental growth in the Industrial and residential sectors may continue to slow from the unusually high levels recorded over the last few years, as new supply comes online in the logistics sector and affordability constraints start to bite in residential. In contrast, rental growth in the stronger parts of the Retail and Office sectors is likely to increase given the material rebasing that has taken place in the Retail sector and the stark scarcity of new development for much of the last decade. Of course, the sector-wide average of moderate rental growth in the Office and Retail sectors hides the dramatic divergence between individual assets in those sectors. Whilst dominant retail parks, and modern well-located city centre offices have been delivering examples of very significant rent increases, other less desirable Retail and Office assets are still struggling to find tenants at all. |
Visit us
Discover a wealth of
real estate expertise, regardless of your business level or stage.
 |
|
|
If you would like to opt out, please get in touch with your Relationship Manager.
The Royal Bank of Scotland plc, The Royal Bank of Scotland N.V, or an affiliated entity (‘RBS’) and for the purposes of Directive 2004/39/EC has not been prepared in accordance with the legal and regulatory requirements to promote the independence of research. Regulatory restrictions on RBS dealing in any financial instruments mentioned at any time before this document is distributed to you do not apply. This document has been prepared for information purposes only. It shall not be construed as, and does not form part of an offer, nor invitation to offer, nor a solicitation or recommendation to enter into any transaction or an offer to sell or a solicitation to buy any security or other financial instrument. No representation, warranty or assurance of any kind, express or implied, is made as to the accuracy or completeness of the information contained herein and RBS and each of their respective affiliates disclaim all liability for any use you or any other party may make of the contents of this document. The contents of this document are subject to change without notice and RBS does not accept any obligation to any recipient to update or correct any such information. Views expressed herein are not intended to be and should not be viewed as advice or as a recommendation. RBS makes no representation and gives no advice in respect of any tax, legal or accounting matters in any applicable jurisdiction. This document is not intended for distribution to, or use by any person or entity in any jurisdiction or country where such distribution or use would be contrary to local law or regulation. The information contained herein is proprietary to RBS and is being provided to selected recipients and may not be given (in whole or in part) or otherwise distributed to any other third party without the prior written consent of RBS. RBS and its respective affiliates, connected companies, employees or clients may have an interest in financial instruments of the type described in this document and/or in related financial instruments. Such interest may include dealing in, trading, holding or acting as market-makers in such instruments and may include providing banking, credit and other financial services to any company or issuer of securities or financial instruments referred to herein. The Royal Bank of Scotland plc. Registered in Scotland No. 90312. Registered Office: 36 St Andrew Square, Edinburgh EH2 2YB. The Royal Bank of Scotland plc is authorised by the Prudential Regulation Authority and regulated by the Financial Conduct Authority and Prudential Regulation Authority. The Royal Bank of Scotland N.V., established in Amsterdam, The Netherlands. Registered with the Chamber of Commerce in The Netherlands, No. 33002587. Authorised by De Nederlandsche Bank N.V. and regulated by the Authority for the Financial Markets in The Netherlands. Agency agreements exist between different members of The Royal Bank of Scotland Group plc.
© Copyright 2026 The Royal Bank of Scotland plc. All rights, save as expressly granted, are reserved. This communication is for the use of intended recipients only and the contents may not be reproduced, redistributed, or copied in whole or in part for any purpose without The Royal Bank of Scotland plc’s prior express consent.
|
|
|