If you cannot see the graphic or access the links within this message please go to the source
|
 |

Turbulent bond market shaking up real estate hierarchy
The benchmark ten-year Gilt yield recently hit its highest level since the height of the Global Financial crisis in 2008. Longer-dated Gilts have seen even more extreme highs, reaching 5.85% in recent weeks, a level not seen since 1998. At that time the Bank of England base rate was 7.25%, compared to just 3.75% today, highlighting the sizeable long-term risk premium currently being demanded by bond investors to lend to the UK government. Although it should be noted that this is not a UK-specific phenomenon, yields on ten-year and 30-year US Treasuries also hit 19-year highs in recent months.
For many property investors, Gilt yields may be of limited immediate concern, let alone US Treasuries. The Bank of England base rate is of course watched very closely, and investors seeking protection from future rate rises will also be watching swap rates, which set the price for hedging rate risk.
However, Gilt yields are actually of huge relevance to anybody who invests in institutional quality real estate. |
Asset allocators use government bond yields as the basis for their required returns from all other asset classes, including real estate. There is nothing new about this concept of course, but one dynamic of the current bond market which perhaps sets it apart from other periods of rising yields, is the sheer scale of issuance from AI hyperscalers.
They have been tapping the bond markets at an unprecedented scale, with almost $200bn borrowed already this year. This has offered investors a huge supply of bonds at a premium to government debt, and increasingly to other investment-grade credit. Whilst rising bond yields will not feed through quickly to direct property valuations, a prolonged period of higher yields can change entrenched perceptions of value and this is now starting to filter through to the property market in a tangible way.
One notable feature of this feedthrough is that the most in-demand, and as a result lower yielding, sectors seem to be more exposed. |
|
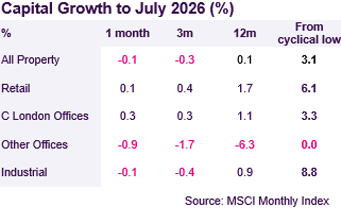
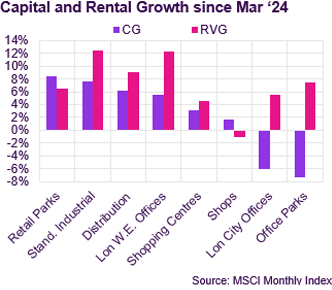
Commercial property returns According to MSCI, average commercial property values declined by 0.1% in July and are now pretty much back to where they were this time last year. The recent capital decline comes despite persistent rental value growth, with rental values rising by 0.2% in July and by 3.2% year-on-year.
The Retail sector continues to show relative resilience, with capital values up by 0.8% year-to-date, driven entirely by rental value growth (+1.1% YTD). Central London Shops have outperformed so far this year (capital growth of 5.2% and rental growth of 2.8%). In contrast, shops outside of the South East continue to record declining values (-1.0% YTD).
The Industrial sector, which outperformed for many years, has lost all momentum, with capital values down by 0.4% since May and flat YTD. Rental value growth remains firmly positive, but the trend continues to slow steadily, with the annual rate dropping back from 10.3% in 2022 and 7.5% in 2023 to an annualised rate of 3.5% so far this year.
In the office sector, London West End has outperformed from a capital growth perspective, (+0.7% YTD). The picture is considerably weaker elsewhere, most notably Outer London where values are off by 5.7% YTD (and by almost 50% since June ’22). Outside the South East, capital values are down by 2.5% on average, despite robust rental growth (+3.0% YTD). |
|
Investment market activity
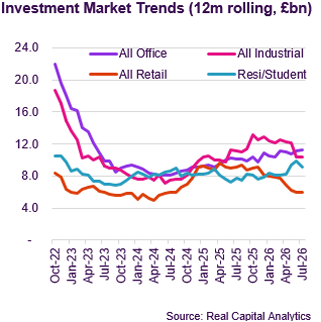 Preliminary data from Real Capital Analytics (RCA) suggest that £1.9bn of transactions completed in July, which would make it the weakest month so far this year. This is a disappointing total after signs of renewed activity in May and June but may yet be restated as agents return from their holidays. The Year-to-Date total of £22bn is around 10% down on last year.
What makes the total market figure even more underwhelming is that £1.3bn is attributed to a single transaction that was initiated late last year. Blue Owl Capital completed on a portfolio of 12 private hospitals, long-let to Spire Healthcare, on behalf of their Net Lease fund.
One sector showing signs of renewed activity, after many years in the doldrums, is shopping centres. In July, Hammerson paid £218m for a 50% share of the Manchester Arndale Centre. The share was previously owned by collapsed REIT Intu, with the other 50% held by M&G. This is the latest of a string of deals involving prime shopping centres, with further similar transactions reported to be in advanced stages.
Whilst the number of Industrial sector transactions has dropped back significantly, the total level of investment continues to be supported by a steady trickle of sizeable portfolio deals. In July, KKR and Mirastar acquired 1.3m sq ft of logistics space across 4 assets from PLP for £170m.
London office sub-markets outside Zone 1 have been very subdued in recent years, but a significant transaction closed in Hammersmith In July. Chinese retailer JD.com acquired newly refurbed 43 Brook Green for their own occupation at an estimated price of £147m. Elsewhere, Northtree IM acquired The Lincoln in Manchester, where occupiers include the Professional Footballers Association, for £55m (6.8% initial yield). |
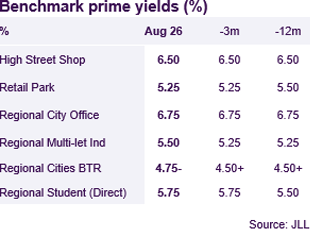
Market yields The JLL yield sheet highlights the pressure on lower yielding property sectors from the upwards trend in benchmark bond yields. In Spring, the 10-year Gilt yield, a widely used reference point for institutional investors, breached the 5% mark for the first time since 2008. It has hovered around that level for much of the time since, in a way that will start to influence valuations.
This impact is illustrated in the wholesale outward movement of the six Industrial sector yield benchmarks reported by JLL. These in part reflect the slowdown in rental growth relative to recent years. However, they are triggered by the dramatic erosion of the risk premium between prime Industrial assets and the “Risk Free Rate” represented by the benchmark Gilt yield.
Similar factors are at play in the Living sectors which JLL have had on a weaker trend in recent months. These sectors are also coming off a period of exceptional rental growth and are at the lower-yielding end of the commercial property market. Prime Build-to-Rent assets typically yield 5% or less, whilst prime student yields are typically just 50bp or so higher. Therefore, both are likely to come under outward pressure if bond yields remain elevated. |
Auctions
Allsop’s commercial auction in July raised total proceeds of £42m, in line with the equivalent auction last year and significantly more than in the previous two auctions. However, higher value lots have still proved hard to shift. Of the nine lots available on the day with guide prices above £1m only three sold. Three of the unsold assets were care homes with short remaining lease terms.
The highest sale price achieved on the day was for an asset that ticked all the auction boxes. The £1.42m was paid for a freehold asset in Greater London comprising four ground floor retail units with residential above, producing a net yield of 8.7%. Other successful higher value sales included convenience retail let to Sainsbury’s and Farm foods on 10- year leases. |
Market forecasts
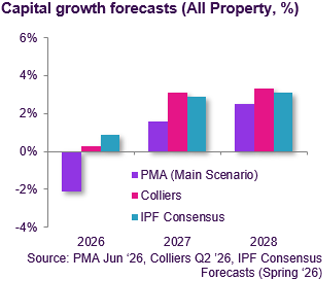
The Real Estate: UK (formerly IPF) Spring Consensus Forecasts, which were published in May, highlight the weakening of sentiment caused by the conflict in the Middle East. The consensus forecast for a healthy 3.2% of capital growth this year was significantly watered down to just 0.9%. The outlook for next year was also downgraded slightly from 3.2% to 2.9%.
In a change from recent years, the consensus is now that Central London Offices will take the lead over Industrial from a capital growth perspective. The West End is expected to outperform with capital growth of 3.0% per annum over five years, marginally ahead of the City at 2.7%. In both cases, capital appreciation is expected to be fully underwritten by rental growth.
The outlook on the Retail sub-sectors is mixed, with Retail Warehouses expected to deliver 2.0% capital growth per annum, whilst Shop values are forecast to grow by 1.4% p.a. and Shopping Centres by just 0.5% p.a. However, Shopping Centres are expected to outperform on a total return basis at 8.2% p.a., just ahead of Retail Warehouses and well ahead of Shops.
Despite losing their crown, the Industrial sector is still expected to deliver healthy capital growth of 2.5% per annum, driven by rental growth of 3.0% p.a. and supporting a total return of 7.2% p.a. over five years.
|
|
Looking forward
Bond yields are of course not the only factor that influences property valuations. A key element of valuing any income producing asset is the potential for income growth. This is of course particularly relevant for real estate where the structure of leases means that the current passing rent may be materially higher or lower than the market rent. In contrast, most bonds have no potential for income growth, and that is where real estate has an advantage over the much larger asset class. This is particularly the case in today’s higher inflation environment which threatens to steadily reduce the real value of any bond which isn’t explicitly index-linked.
Real estate is by no means a pure inflation hedge, but as the name suggests it does have the capacity to capture inflationary upside. Indeed, that has been the case in recent years despite the volatile geopolitical and interest rate environment. Between 2023 and 2025 the MSCI Annual Index, which includes many thousands of individual properties, recorded an average increase in net income of more than 10%. This average hides a wide variation at a sector level. MSCI report that the Industrial and Residential sectors delivered income growth of more than 20% over that period, whilst the Retail sector crawled along at barely 1% per annum and the Office sector fared little better.
Naturally, the outperforming sectors have been in high demand from investors who have bid yields down to a low level in anticipation of further growth. However, sector-level forecasts now imply a far more level playing field over the next five years, with consensus forecasts pointing towards something like 2-3% per annum rental growth on average for each of the main sectors. In combination, the twin impacts of higher medium-term interest rates and a levelling out of income growth prospects, suggest a re-ordering of the hierarchy where previously unloved sectors benefit from both higher income and more interest rate resilience. However, a word of caution again on averages. Offices and Retail may well deliver outperformance at a sector level over the next few years, but poor stock selection in these sectors still has the potential to exact a hefty toll. |
Visit us
Discover a wealth of
real estate expertise, regardless of your business level or stage.

Author
Tom Sharman
Head of Strategy
NatWest Real Estate Finance
|
|
|
If you would like to opt out, please get in touch with your Relationship Manager.
This document has been prepared by National Westminster Bank Plc or an affiliated entity (“NatWest”) exclusively for internal consideration by the recipient (the “Recipient” or “you”) for information purposes only. This document is incomplete without reference to, and should be viewed solely in conjunction with, any oral briefing provided by NatWest. NatWest and its affiliates, connected companies, employees or clients may have an interest in financial instruments of the type described in this document and/or in related financial instruments. Such interests may include dealing in, trading, holding or acting as market-maker in such instruments and may include providing banking, credit and other financial services to any company or issuer of securities or financial instruments referred to herein. NatWest is not and shall not be obliged to update or correct any information contained in this document. This document is provided for discussion purposes only and its content should not be treated as advice of any kind. This document does not constitute an offer or invitation to enter into any engagement or transaction or an offer or invitation for the sale, purchase, exchange or transfer of any securities or a recommendation to enter into any transaction, and is not intended to form the basis of any investment decision. This material does not take into account the particular investment objectives, financial conditions, or needs of individual clients. NatWest will not act and has not acted as your legal, tax, regulatory, accounting or investment adviser; nor does NatWest owe any fiduciary duties to you in connection with this, and/or any related transaction and no reliance may be placed on NatWest for investment advice or recommendations of any sort. Neither this document nor our analyses are, nor purport to be, appraisals or valuations of the assets, securities or business(es) of the Recipient or any transaction counterparty. NatWest makes no representation, warranty, undertaking or assurance of any kind (express or implied) with respect to the adequacy, accuracy, completeness or reasonableness of this document, and disclaims all liability for any use you, your affiliates, connected companies, employees, or your advisers make of it. Any views expressed in this document (including statements or forecasts) constitute the judgment of NatWest as of the date given and are subject to change without notice. NatWest does not undertake to update this document or determine the accuracy or reasonableness of information or assumptions contained herein. NatWest accepts no liability whatsoever for any direct, indirect or consequential losses (in contract, tort or otherwise) arising from the use of this material or reliance on the information contained herein. However, this shall not restrict, exclude or limit any duty or liability to any person under any applicable laws or regulations of any jurisdiction which may not be lawfully disclaimed. The information in this document is confidential and proprietary to NatWest and is intended for use only by you and should not be reproduced, distributed or disclosed (in whole or in part) to any other person without our prior written consent.
National Westminster Bank Plc. Registered in England & Wales No. 929027. Registered Office: 250 Bishopsgate, London EC2M 4AA. National Westminster Bank Plc is authorised by the Prudential Regulation Authority, and regulated by the Financial Conduct Authority and the Prudential Regulation Authority.
|
|
|