If you cannot see the graphic or access the links within this message please go to the source
|
 |

Premium Industrial pricing may no longer be justified
Back in the mists of time, industrial property was considered to be somewhat boring. Most ambitious young professionals would angle for the more glamorous and dynamic office and retail sectors. That pattern was well and truly shattered over the last decade as “sheds” left their two mainstream rivals in the dust. In the ten years to 2025, MSCI recorded more than 70% growth in average Industrial rents.
This massively outperformed Offices (up 19%) and contrasted dramatically with Retail (down 12%). Unsurprisingly this growth attracted investors, and Industrial grew from around 10% of institutional portfolios to more than a third. With the other traditional mainstream sectors experiencing significant challenges, the divergence from a capital growth perspective was dramatic.
Industrial asset values increased up by an average of 64% over 10 years, whilst Office values declined by an average of 28% and Retail values by an average of 39% over that same period. As a result, the premium for Industrial assets over their notional equivalents in the Office and Retail sectors became material and entrenched. |
By 2022 the Industrial sector was arguably priced for perfection, and when interest rates rose sharply the sector was the hardest hit, with values falling by 25% in just months. This correction came despite red hot occupier conditions, with annual rental growth running at more than 12% at the time.
This income growth potential undoubtedly softened what could have been an even harder landing and ensured that the sector was the first to show signs of recovery, with capital values rebounding by almost 10% between 2023 and 2025.
However, underlying rental growth was slowing steadily and is now running at an annualised rate of around 3%. Still perfectly solid, but no longer market beating. Central London Offices and Retail Parks have delivered comparable rental growth in recent times, whilst even the much-maligned shopping centre and regional office markets are not far behind. The decade of Industrial exceptionalism is over. |
|
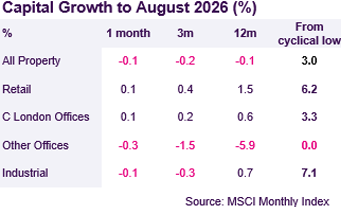
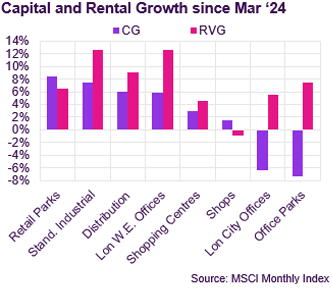
Commercial property returns According to MSCI, average commercial property values declined by 0.1% in August. It is now six months since any capital growth has been recorded on the Monthly Index, and values are now marginally lower than they were at the start of the year. This is despite steady rental value growth, with rental values rising by 0.2% in August and by 1.8% year-to-date.
The Retail sector continues to show relative resilience, with capital values up by 0.9% year-to-date, driven entirely by rental value growth (+1.1% YTD). Central London Shops have outperformed so far this year (capital growth of 5.3% and rental growth of 3.0%). In contrast, shops outside of the South East continue to record declining values (-1.2% YTD).
The Industrial sector, which outperformed for many years, has lost all momentum, with capital values down by 0.5% since May and by 0.1% YTD. Rental value growth remains firmly positive, but the trend continues to slow steadily, with the annual rate dropping back from 10.3% in 2022 and 7.5% in 2023 to an annualised rate of 3.4% so far this year.
In the Office sector, London West End has outperformed from a capital growth perspective, (+1.3% YTD). The picture is considerably weaker elsewhere, most notably Outer London where values are off by 5.8% YTD (and by almost 50% since June ’22). Outside the South East, capital values are down by 2.9% on average, despite robust rental growth (+3.3% YTD). |
|
Investment market activity
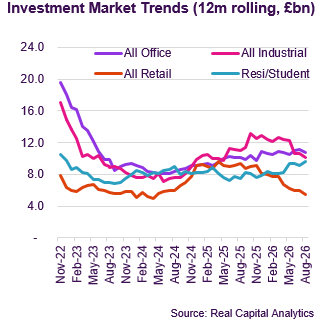 Preliminary data from Real Capital Analytics (RCA) suggest that £1.8bn of transactions completed in August, which would make it the weakest month so far this year. Albeit reporting can often be delayed over the summer months; Initial data for July suggested a very weak £1.9bn, yet has since been updated to almost £2.5bn. The Year-to-Date total of £22bn is around 13% lower than at the same point last year.
Border to Coast Pensions Partnership completed the largest single-family transaction of the year so far, acquiring 866 homes from Blackstone-owned Leaf Living. The acquired portfolio comprises 12 estates across South East England and has a combined value of around £400m. Border to Coast invest on behalf of 14 local government pension schemes.
The largest transaction within traditional commercial property sectors was the sale of 1 St James’ Square, a prime London West End office leased to BP until 2028, for £291m. The buyer, Czech investor KKCG, set up a London platform in 2025 to target prime Central London real estate.
Outside of Central London, investment activity in the office sector has been limited. However, Martley Capital’s regional office platform, which is targeting £500m of assets, acquired the Lewis Building and Priory Court in Birmingham for £60m. The assets were marketed for sale at £73m in March ’25 after the previous owners defaulted on loan covenants.
US REITs continue to target the UK, with the latest significant transaction taking place in the care home sector. CareTrust REIT, based in California, acquired 16 leased care homes for £168m, taking their UK portfolio to almost 8,000 beds across 139 assets. |
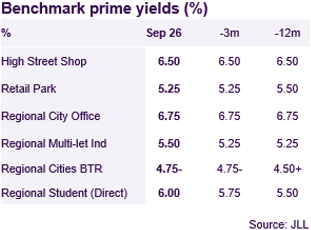
Market yields Medium-term interest rates have risen sharply in recent months, putting significant upward pressure on property yields. At the time of writing, the five-year SONIA swap rate is 4.75%, up by 50bp in 3 months and by 90bp since this time last year. The 10-year Gilt yield, a widely used reference point for institutional investors, breached the 5% mark earlier in the year for the first time in 18 years and has passed 5.3% in recent weeks.
Lower yielding sectors have been the first to see a negative impact from higher rates, with several residential benchmark yields reported by JLL to have softened in recent months. The student accommodation sector, which has also experienced mixed occupier conditions, has been notably impacted, with prime regional benchmarks moving out by a further 25bp in September.
The Industrial sector, with prime benchmarks at 4.75%-5.25% 3 months ago, was also exposed to a combination of higher rates and moderating rental growth. JLL perceive that benchmarks are now stable at 5.0%-5.5%, but there must be a higher than usual degree of uncertainty around these levels given the shortage of transactional evidence in recent months.
|
Auctions
Data from EIG suggest that the commercial auction sector has been in reasonably good health over the summer, with lots offered up by 18% and sales up by 20% year-on-year. However, the total raised only increased by 5%, reflecting a 15% decline in the average sale price. This trend aligns with recent anecdotal evidence where larger lots have struggled to sell, and may also reflect a gradual acceptance by vendors of lower asking prices.
Acuitus were one of the few auction houses to run a commercial auction in August and the results suggest that many potential investors may still have been on holiday. Of 25 lots available on the day, only six sold at auction with one more being sold post. The highest price achieved was £3.08m for an office building in Staines, reflecting a capital value of just £45 per square foot. |
Market forecasts
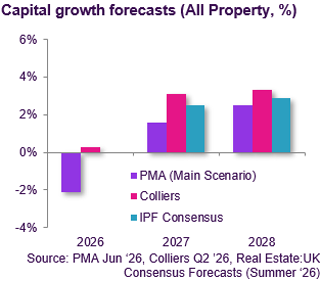
The Real Estate:UK Summer Consensus Forecasts, highlight declining sentiment since the start of the Middle East conflict and the resulting impact on medium-term interest rates. The consensus forecast six months ago was for a healthy 3.2% of capital growth this year, but the latest survey, compiled over the summer, predicts no growth at all in ’26 and downgrades forecasts for ’27.
Notably the change in sentiment has had limited impact on rental growth forecasts which remain fairly benign. The five-year forecast of 2.5% per annum only represents a very modest downgrade from the previous prediction of 2.6% p.a. The forecasts imply only very minor yield compression from next year.
At a sector-level, long-time rental growth outperformers Industrial (5 year forecast of 2.9% p.a.) are steadily dropping back into the pack and are now only very marginally ahead of Offices and Shops (2.8% p.a.). Central London Offices specifically are expected to outperform with growth of 3.1-3.2% p.a.
Capital growth forecasts follow a similar pattern, but once income returns are considered the picture looks quite different. Retail Warehouses and Shopping Centres lead the way with five-year total return forecasts of 8.0% and 7.7% p.a. respectively, ahead of Industrial (7.2%) and CL Offices (6.6%). |
|
Looking forward
The Industrial sector is not a single homogenous entity of course, and the outlook varies widely across different locations and formats. In the Big Box market, a combination of speculative development and slightly softer occupier demand has restored the balance of power between landlords and tenants. Whilst headline rents continue to edge upwards, incentives have moved out to 15-18 months rent free on a ten-year lease. Although this is unlikely to deteriorate much further (from a landlord’s perspective) given that development starts have slowed significantly, it nonetheless represents a meaningful drag on net effective rents since 2023 when rent frees were closer to 10 months. There are still locations where supply remains tight, notably around regional cities, but the previous assumption that tenants would have limited alternative is no longer as safe as it once was.
Other corners of the Industrial market still look more landlord friendly. Multi-let estates (and urban logistics) still benefit from extremely low levels of new supply. Newmark estimated earlier this year that total space under construction nationwide only equated to one month of national take-up. Arguably the greater challenge for that sub-sector is that the dramatic rise in rental values has tested affordability, particularly around London and the South East. This has resulted in some increase in vacancy rates, even if they remain lower than long-term historical norms for the multi-let sector. Vacancy has traditionally been more elevated than in other sectors given shorter average lease lengths and greater tenant churn. However, both factors are now broadly similar to those seen in the office and retail sectors.
One final interesting trend is that unlike offices in particular, where a relatively small cohort of prime assets have massively outperformed more secondary stock, the depth and breadth of tenant demand for multi-let industrial has supported a broader spectrum of properties. Data from Newmark shows that rental growth for good secondary assets has actually accelerated, closing the gap with prime as tenants seek more affordable alternatives. |
Visit us
Discover a wealth of
real estate expertise, regardless of your business level or stage.

Author
Tom Sharman
Head of Strategy
NatWest Real Estate Finance
|
|
|
If you would like to opt out, please get in touch with your Relationship Manager.
This document has been prepared by National Westminster Bank Plc or an affiliated entity (“NatWest”) exclusively for internal consideration by the recipient (the “Recipient” or “you”) for information purposes only. This document is incomplete without reference to, and should be viewed solely in conjunction with, any oral briefing provided by NatWest. NatWest and its affiliates, connected companies, employees or clients may have an interest in financial instruments of the type described in this document and/or in related financial instruments. Such interests may include dealing in, trading, holding or acting as market-maker in such instruments and may include providing banking, credit and other financial services to any company or issuer of securities or financial instruments referred to herein. NatWest is not and shall not be obliged to update or correct any information contained in this document. This document is provided for discussion purposes only and its content should not be treated as advice of any kind. This document does not constitute an offer or invitation to enter into any engagement or transaction or an offer or invitation for the sale, purchase, exchange or transfer of any securities or a recommendation to enter into any transaction, and is not intended to form the basis of any investment decision. This material does not take into account the particular investment objectives, financial conditions, or needs of individual clients. NatWest will not act and has not acted as your legal, tax, regulatory, accounting or investment adviser; nor does NatWest owe any fiduciary duties to you in connection with this, and/or any related transaction and no reliance may be placed on NatWest for investment advice or recommendations of any sort. Neither this document nor our analyses are, nor purport to be, appraisals or valuations of the assets, securities or business(es) of the Recipient or any transaction counterparty. NatWest makes no representation, warranty, undertaking or assurance of any kind (express or implied) with respect to the adequacy, accuracy, completeness or reasonableness of this document, and disclaims all liability for any use you, your affiliates, connected companies, employees, or your advisers make of it. Any views expressed in this document (including statements or forecasts) constitute the judgment of NatWest as of the date given and are subject to change without notice. NatWest does not undertake to update this document or determine the accuracy or reasonableness of information or assumptions contained herein. NatWest accepts no liability whatsoever for any direct, indirect or consequential losses (in contract, tort or otherwise) arising from the use of this material or reliance on the information contained herein. However, this shall not restrict, exclude or limit any duty or liability to any person under any applicable laws or regulations of any jurisdiction which may not be lawfully disclaimed. The information in this document is confidential and proprietary to NatWest and is intended for use only by you and should not be reproduced, distributed or disclosed (in whole or in part) to any other person without our prior written consent.
National Westminster Bank Plc. Registered in England & Wales No. 929027. Registered Office: 250 Bishopsgate, London EC2M 4AA. National Westminster Bank Plc is authorised by the Prudential Regulation Authority, and regulated by the Financial Conduct Authority and the Prudential Regulation Authority.
|
|
|