(1) For details on dependencies applicable to and reliance on our climate and sustainability-related ambitions, targets and commitments, refer to ‘Climate and sustainability-related risks’, ‘Additional cautionary statement regarding climate and sustainability-related data, metrics and forward looking statements’, and ‘Cautionary statements in relation to the climate and sustainability related disclosures in this report’ on pages 420 to 422, 429 and 430 of our 2025 Annual Report and Accounts.
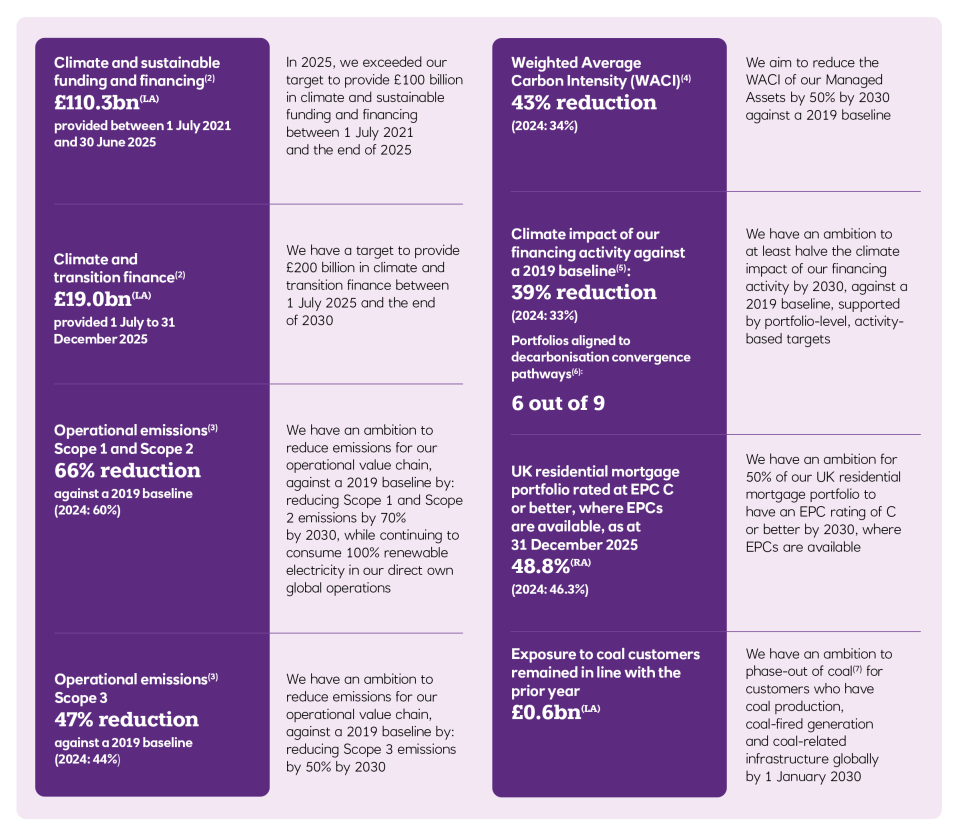
(2) Climate and sustainable funding and financing (as defined in our climate and sustainable funding and financing inclusion criteria) and climate and transition finance, (as defined in our climate and transition finance framework) represent only a relatively small proportion of our overall funding, financing and facilitation activities.
(3) Our operational emissions comprise greenhouse gas emissions Scopes 1, 2 and 3 (categories 1–14, excluding categories 8, 10 and 14) and does not include Scope 3 category 15 financed emissions. The reporting year runs from 1 October to 30 September.
(4) Our WACI ambition includes listed equity and corporate fixed income asset classes. We consider Managed Assets (those assets we invest on our customers’ behalf, which represented 81% of AUM as at 31 December 2025) to be in-scope for our WACI ambition. Due to improved data sourcing, current WACI measurement includes additional data for government bond asset classes and Bespoke portfolios. Our WACI ambition applies to equity and corporate fixed income assets only.
(5) Scope 3 category 15 financed emissions (customer Scope 1 and 2) from lending and investments, refer to page 54 of our 2025 Annual Report and Accounts. Estimated financed emissions are reported as at 31 December 2024. Our financing activity may result in a non-linear emissions profile, both within and across sectors.
(6) Based on 2024 emissions, reflecting the nine portfolio-level activity-based targets for which convergence pathways have been developed with reference to external scenarios. A 2023 comparative is not provided as these are new targets. In general, year-on-year fluctuations in convergence status are expected as the availability of customer emissions data improves and methodologies are refined.
(7) The phase-out of coal refers to the exit of the customer relationship by NatWest Group. This relates to all grades of thermal coal (e.g. bituminous, sub-bituminous, and lignite) typically used as a fuel for coal-fired generation. Data challenges, particularly the lack of granular customer information, create challenges in identifying customers with ‘coal-related infrastructure’ and other customers with coal-related operations within NatWest Group’s large and diversified customer portfolios. As such, the scope excludes (i) companies who generate less than 5% of their revenues via coal related activity (in line with the UN Environment Programme Finance Initiative (UNEP FI) Guidance for Climate Target Setting for Banks) (ii) companies with a turnover of <£50 million, and (iii) commodity traders. Metallurgical coal is excluded from scope.
(LA) Metric subject to independent Limited Assurance by EY.
(RA) Metric subject to independent Reasonable Assurance by EY. Refer to page 71 of our 2025 Annual Report and Accounts.